Market Breadth, Market Condition Signals, and Market Regime

Before I automated anything, I spent a good 6 months just studying the market. No code, no system yet, just me and the charts.
Everything I came up with came out of watching one thing: the QQQ, my market monitor. It turned into three separate angles, and this post walks through all three. If you want the engineering side of how the platform itself got built, that story is over here. This one is about the studying that came first. And when studying each one, I also studied hundreds of stocks alongside it, to understand their movement over time together with the QQQ’s, across multiple timeframes. Hence why the study took 6 months and not 6 days!
1) Market Breadth using T2108 % (Daily timeframe)
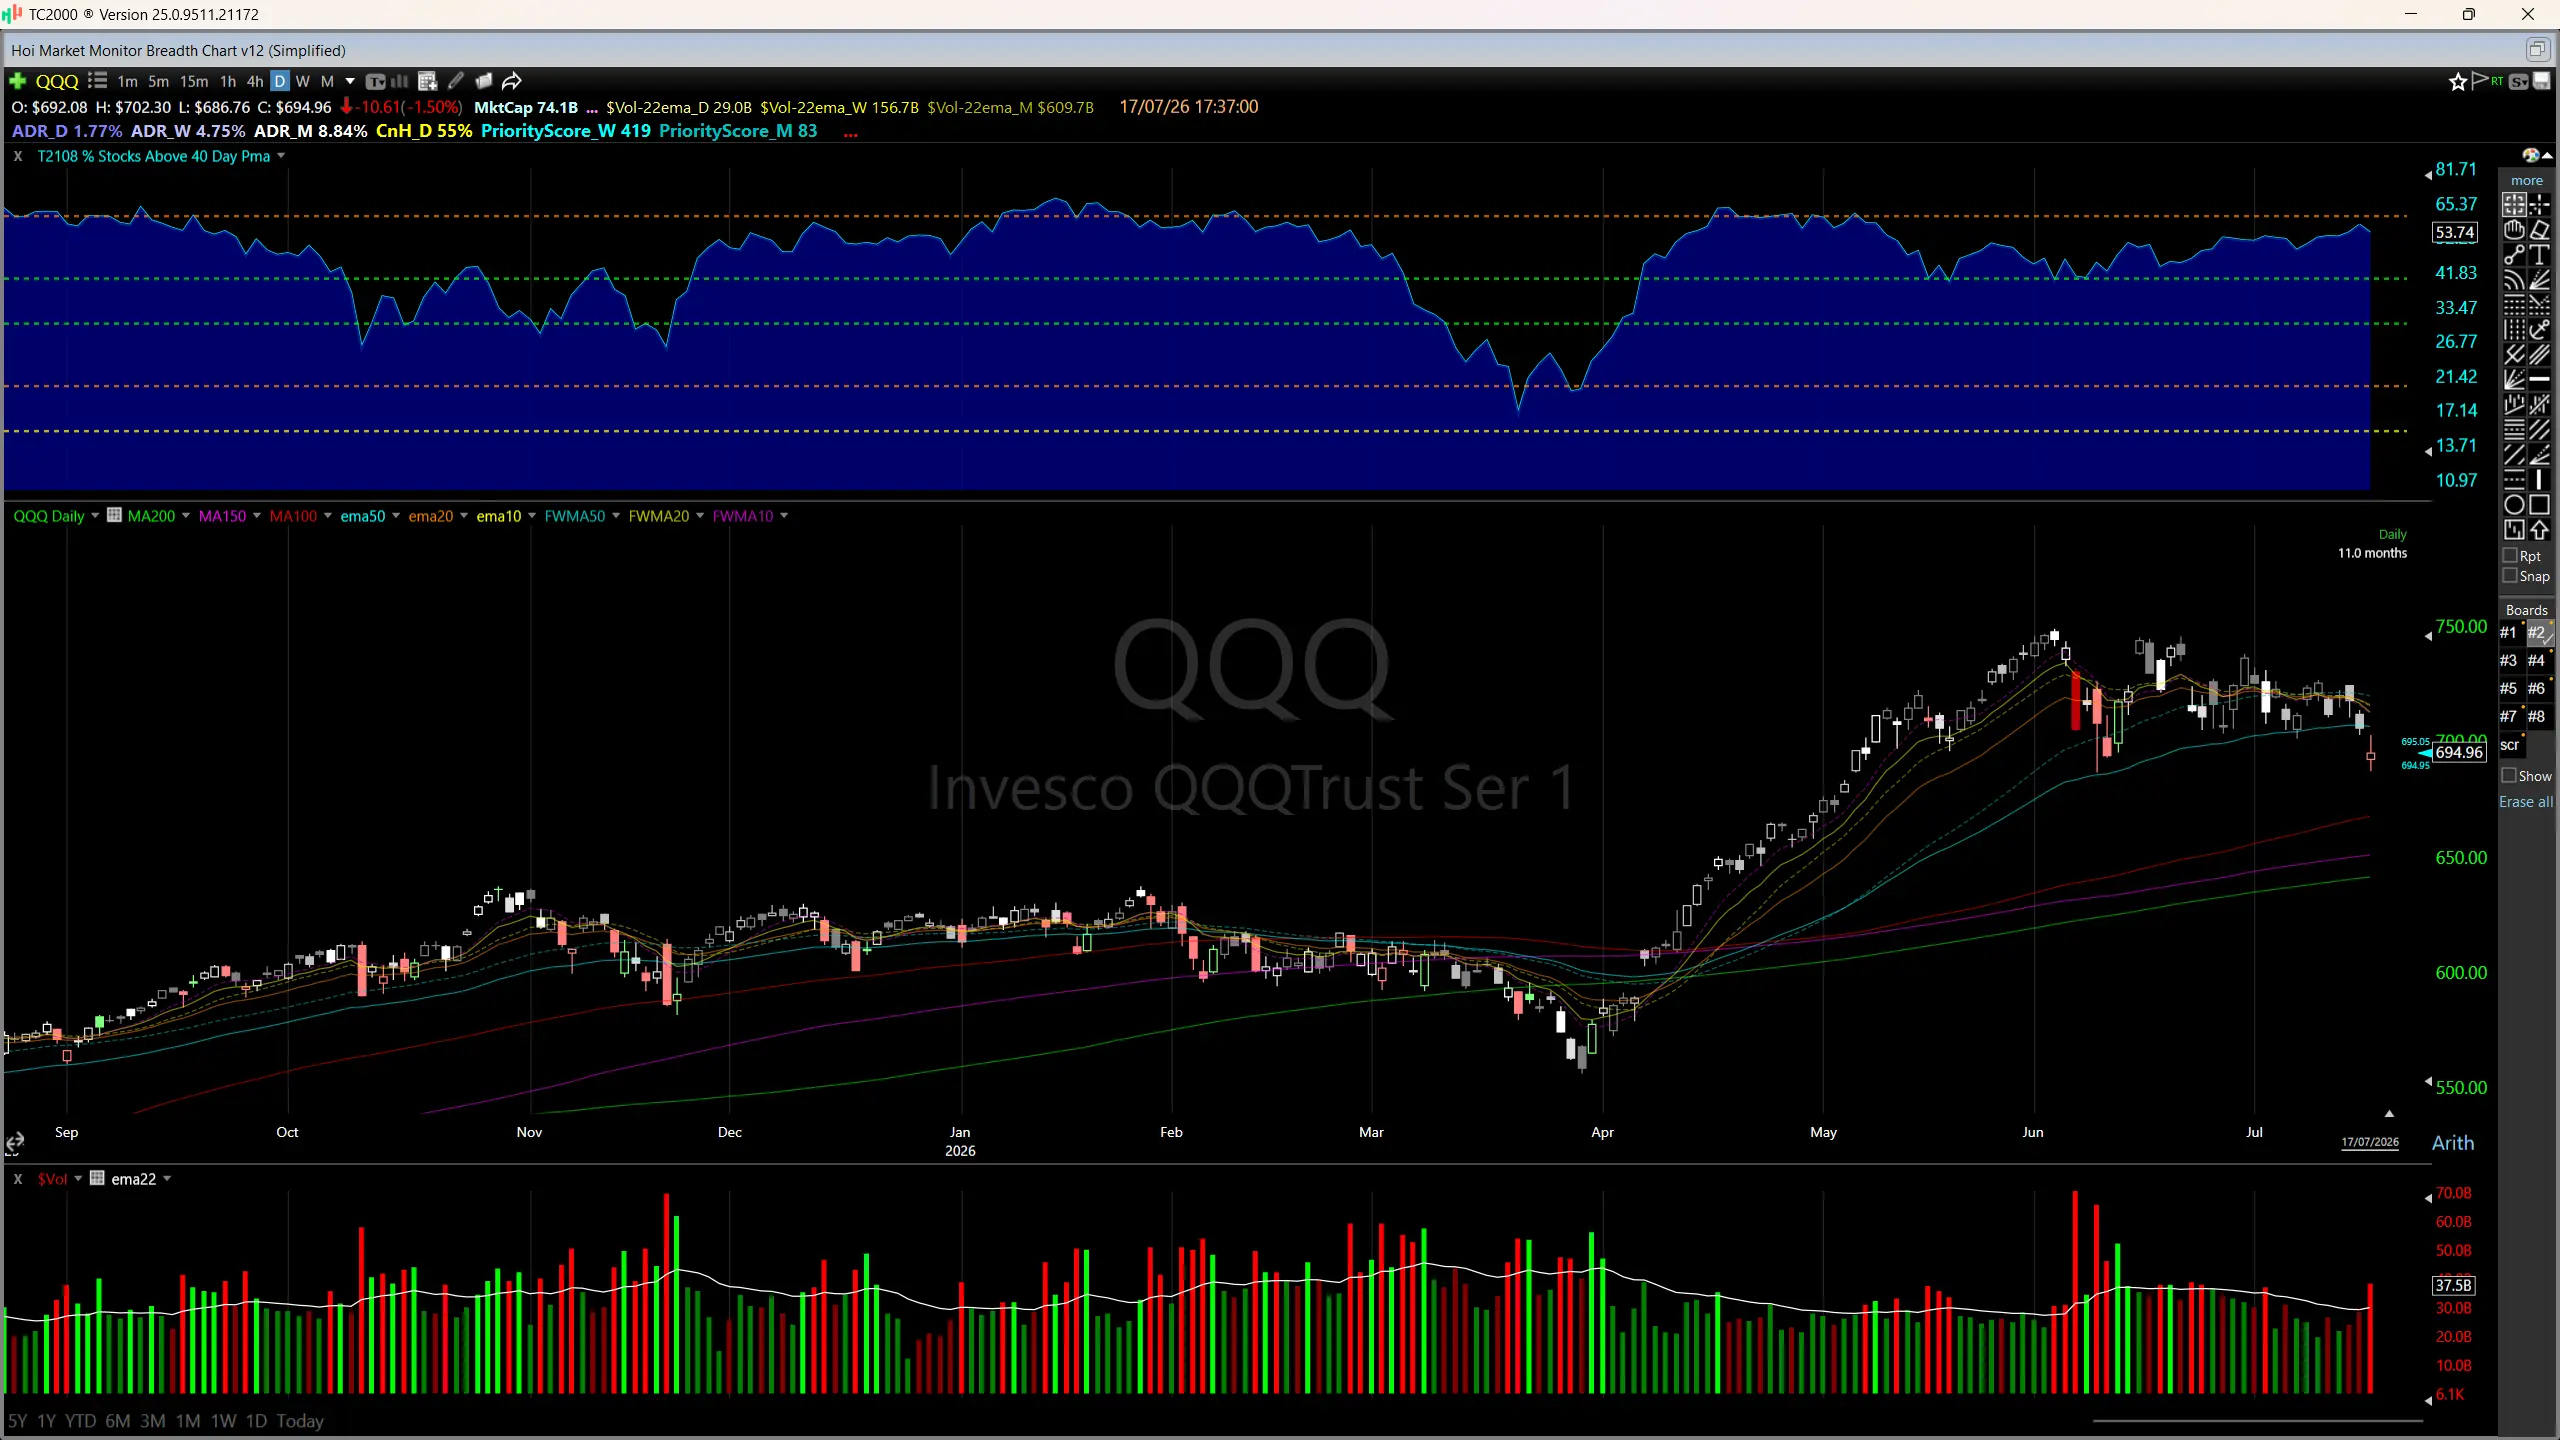
The original idea came from Stockbee: the T2108, the percentage of stocks trading above their 40-day moving average. Think of it as a headcount. When most stocks are above that line, the market is broadly healthy. When the number falls away, the move is being carried by fewer and fewer names, even while the index itself still looks fine. I still use it today, but on the daily timeframe only.
I ran it against years of QQQ price history to see where it actually mattered. On the screenshot below, the T2108 is the blue area up top. The dashed lines are mine, marking the levels where, again and again, it tends to bounce off support or stall at resistance.
2) QQQ Price Volume Action (PVA) + MACD signals (Weekly timeframe)
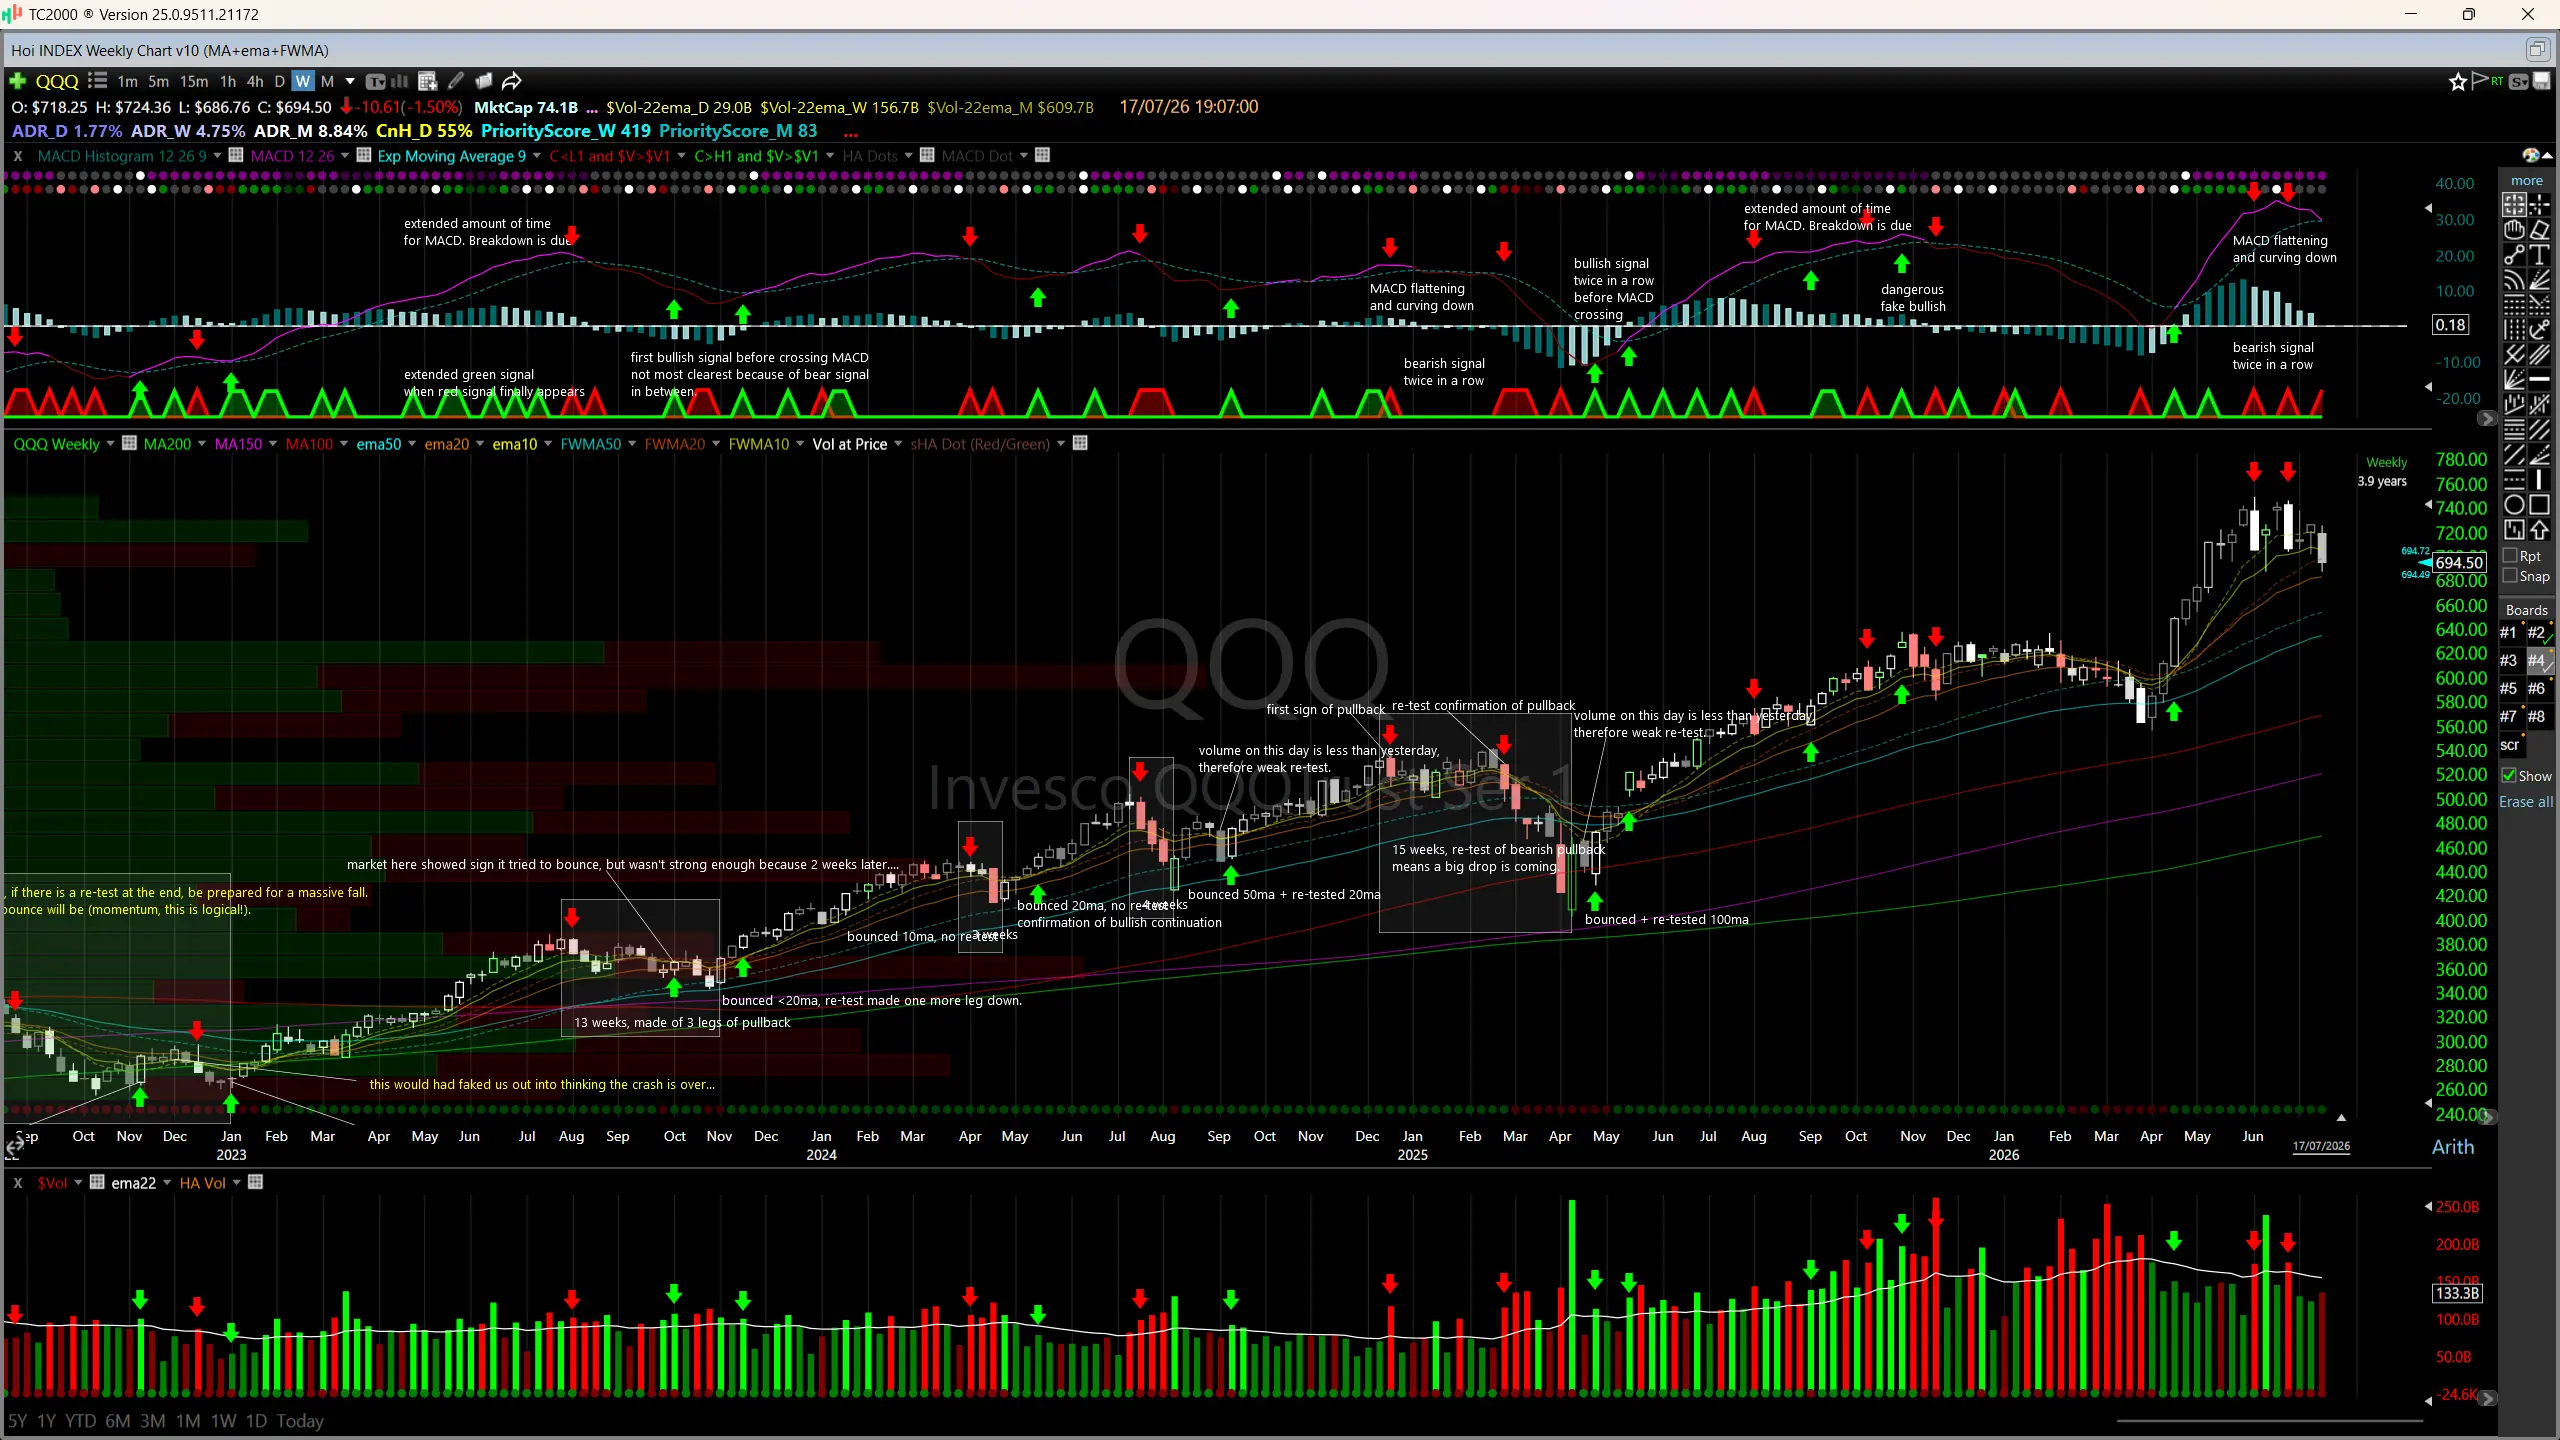
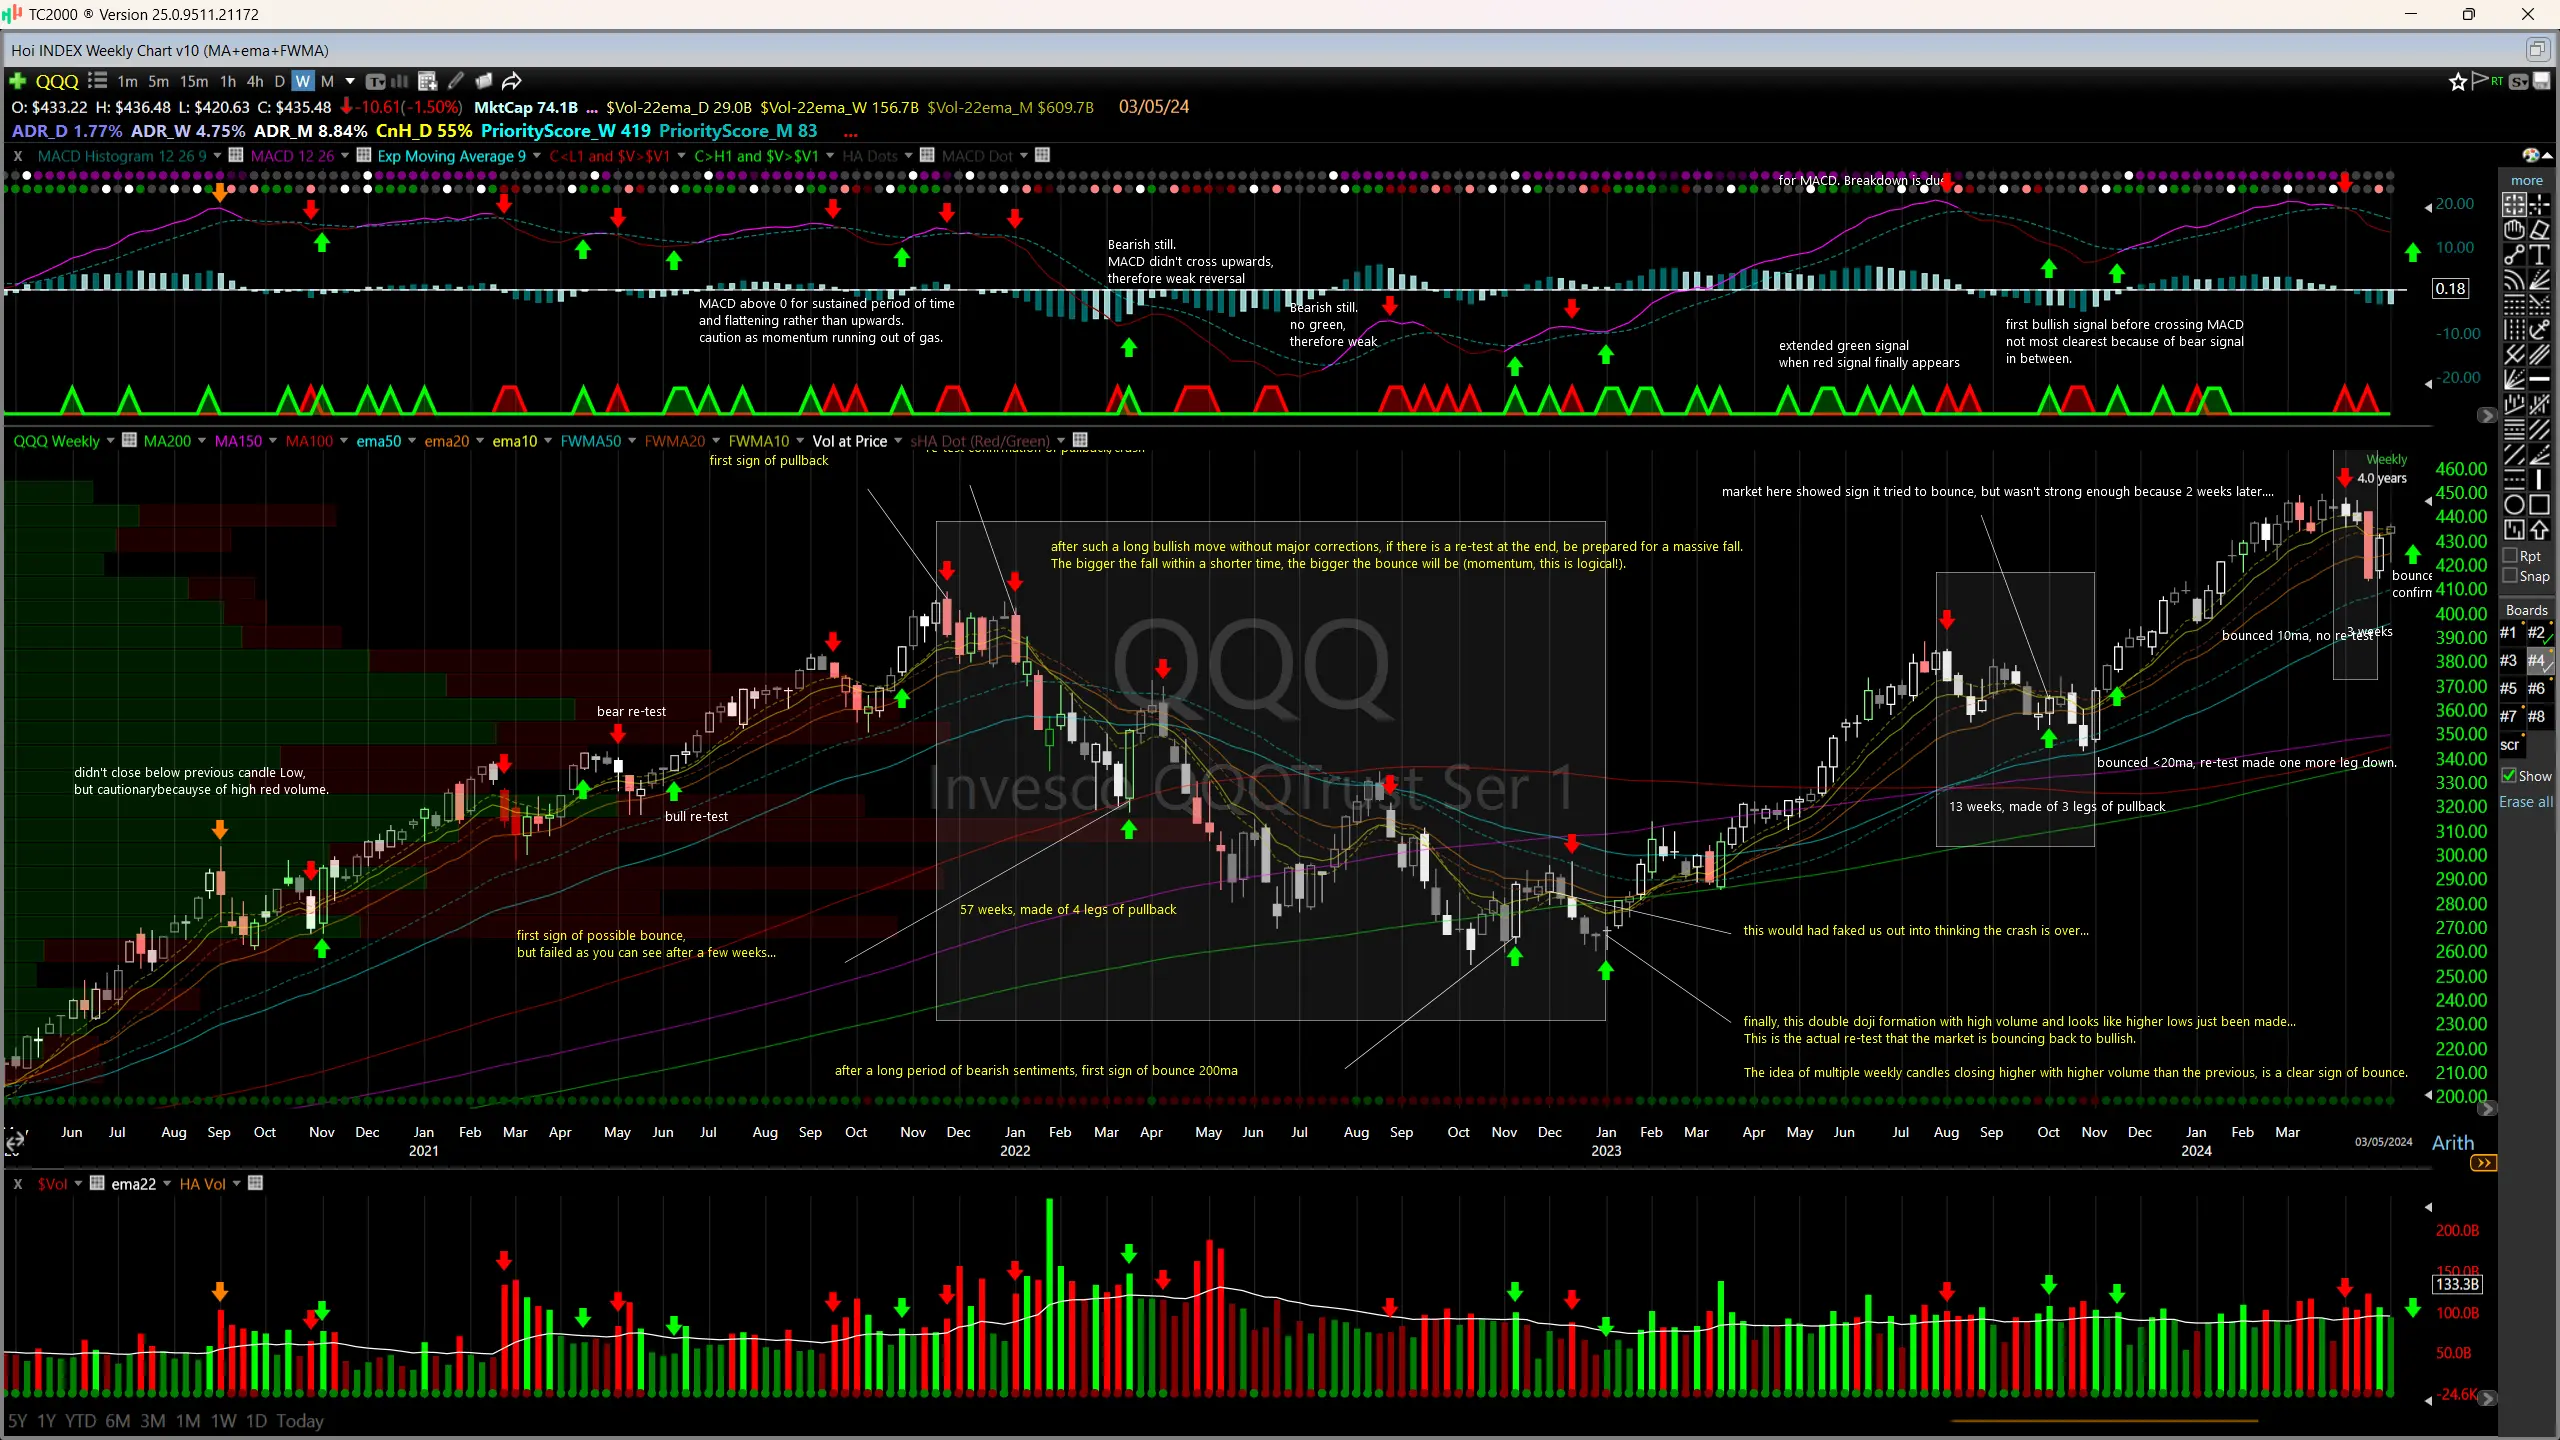
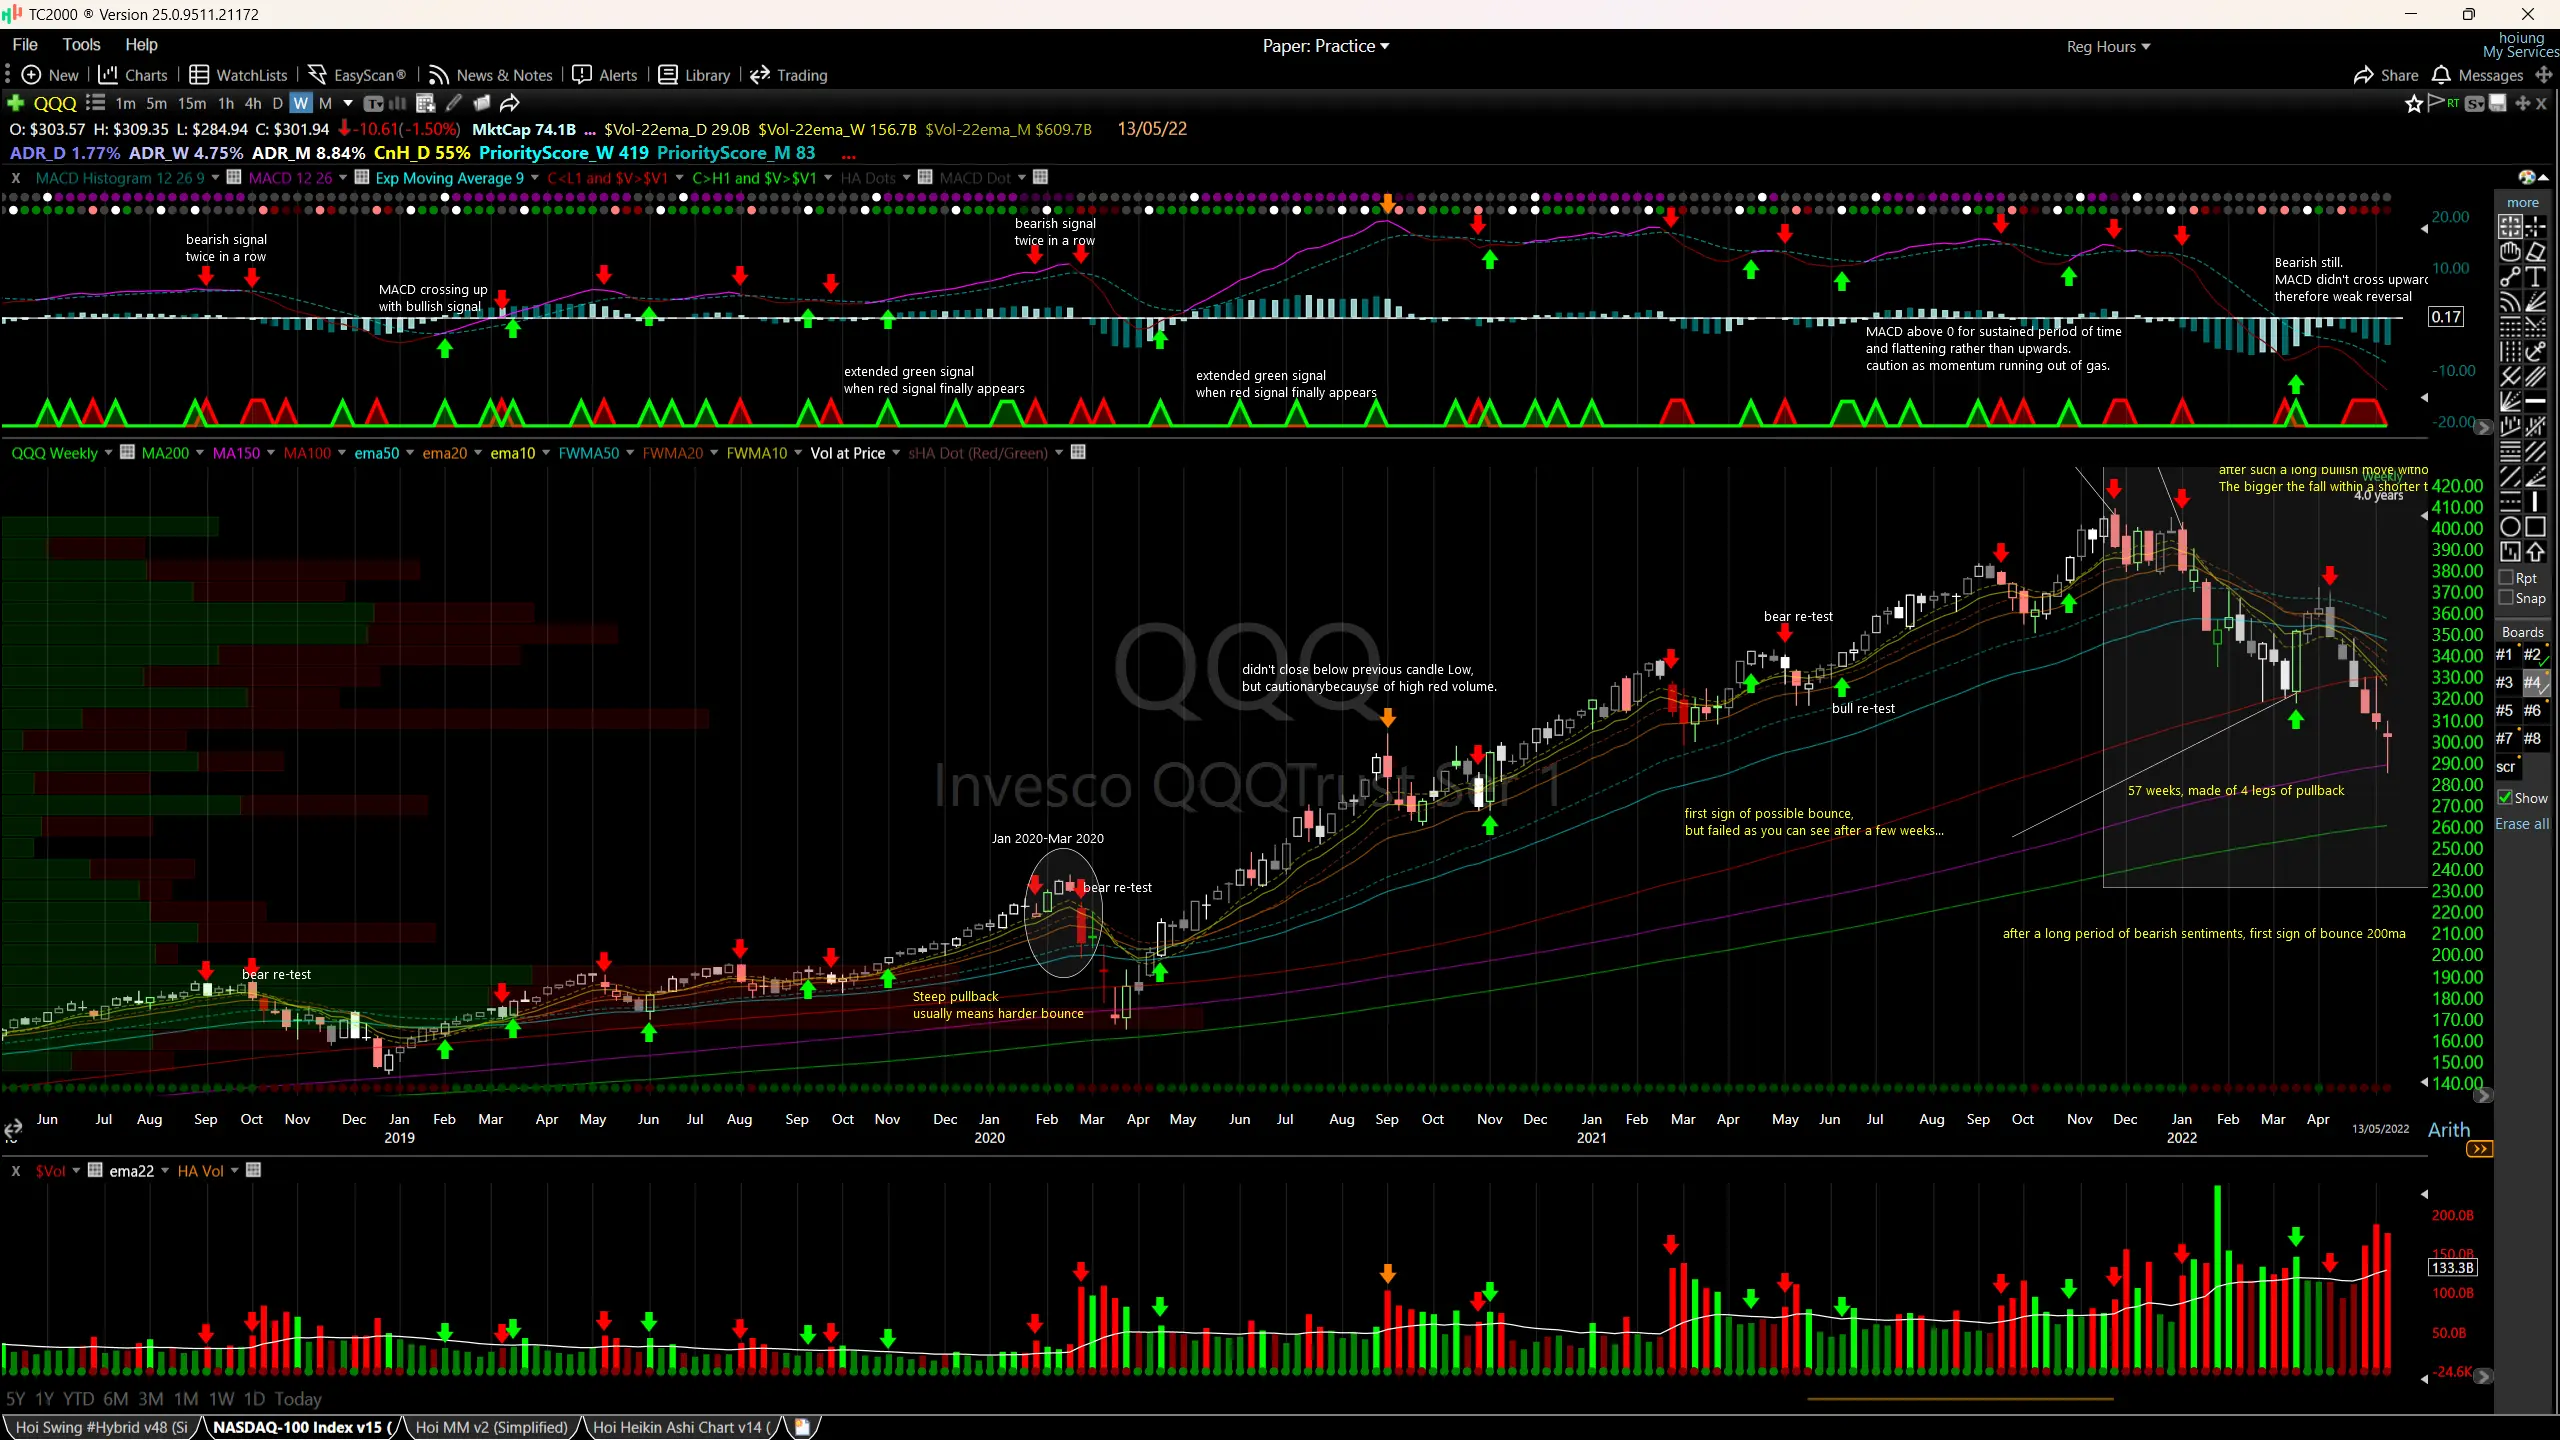
Next, based on my studies and experiments, I wrote two simple formulas of my own for price volume action (PVA). Really just price measured against the previous bar, and dollar volume ($vol) against the previous bar. Later I laid standard MACD settings on top, to see whether the two lined up. Here is what I landed on:
bullish ⍙ C>H1 and $V>$V1 is true, AND MACD just crossed up ⤯ (early, not late), or curling up ◡ (market reversing). Stronger on a confirmed bullish PVA.
bearish ⍙ C<L1 and $V>$V1 is true, AND (after an extended cross) MACD curling over at the top ⌒, or just crossed down ⤰ (early, not late). Worse on a second confirmed bearish PVA, market breaking down.
I studied the PVA on its own first and mapped out my own reading of it, then added the MACD layer. The thing I kept noticing: you have to read them together, not on their own. Either one on its own throws too many false signals. Together, they filter each other.
3) Market Regime: QQQ MA lines (Weekly + Daily timeframe combined)
This is the one I actually wired into the automated system, as a simple ON/OFF gate that either lets me trade or blocks me.
It all came out of manual studying on TC2000. If you look back at the earlier charts you will spot a lot of different moving average lines. I added and removed those constantly, going right back through the whole of QQQ’s history, just to see where price tends to bounce and where it runs into resistance. This is the final set I settled on:
- MA200, MA150, MA100 (MA = simple moving average)
- ema50, ema20, ema10 (ema = exponential moving average)
- FWMA50, FWMA20, FWMA10 (FWMA = forward weighted moving average)
Then I tested it across the daily and the weekly, looking at the two side by side. The monthly I dropped, because over the bigger periods it barely ever bounces, so it added nothing. Daily and weekly together told me what I needed, and that was good enough to turn into a rule.
Here is the actual algorithm for the OPEN and CLOSED regime. On the plan-trade page, my system blocks any new trade while the regime is CLOSED, though I have left myself a manual override for when I’m feeling risky on a bounce.
daily:   Price > EMA50 = OPEN | Price <= EMA50 = CLOSED
weekly:  EMA20 > EMA50 = OPEN | EMA20 <= EMA50 = CLOSED
monthly: (inherits weekly)
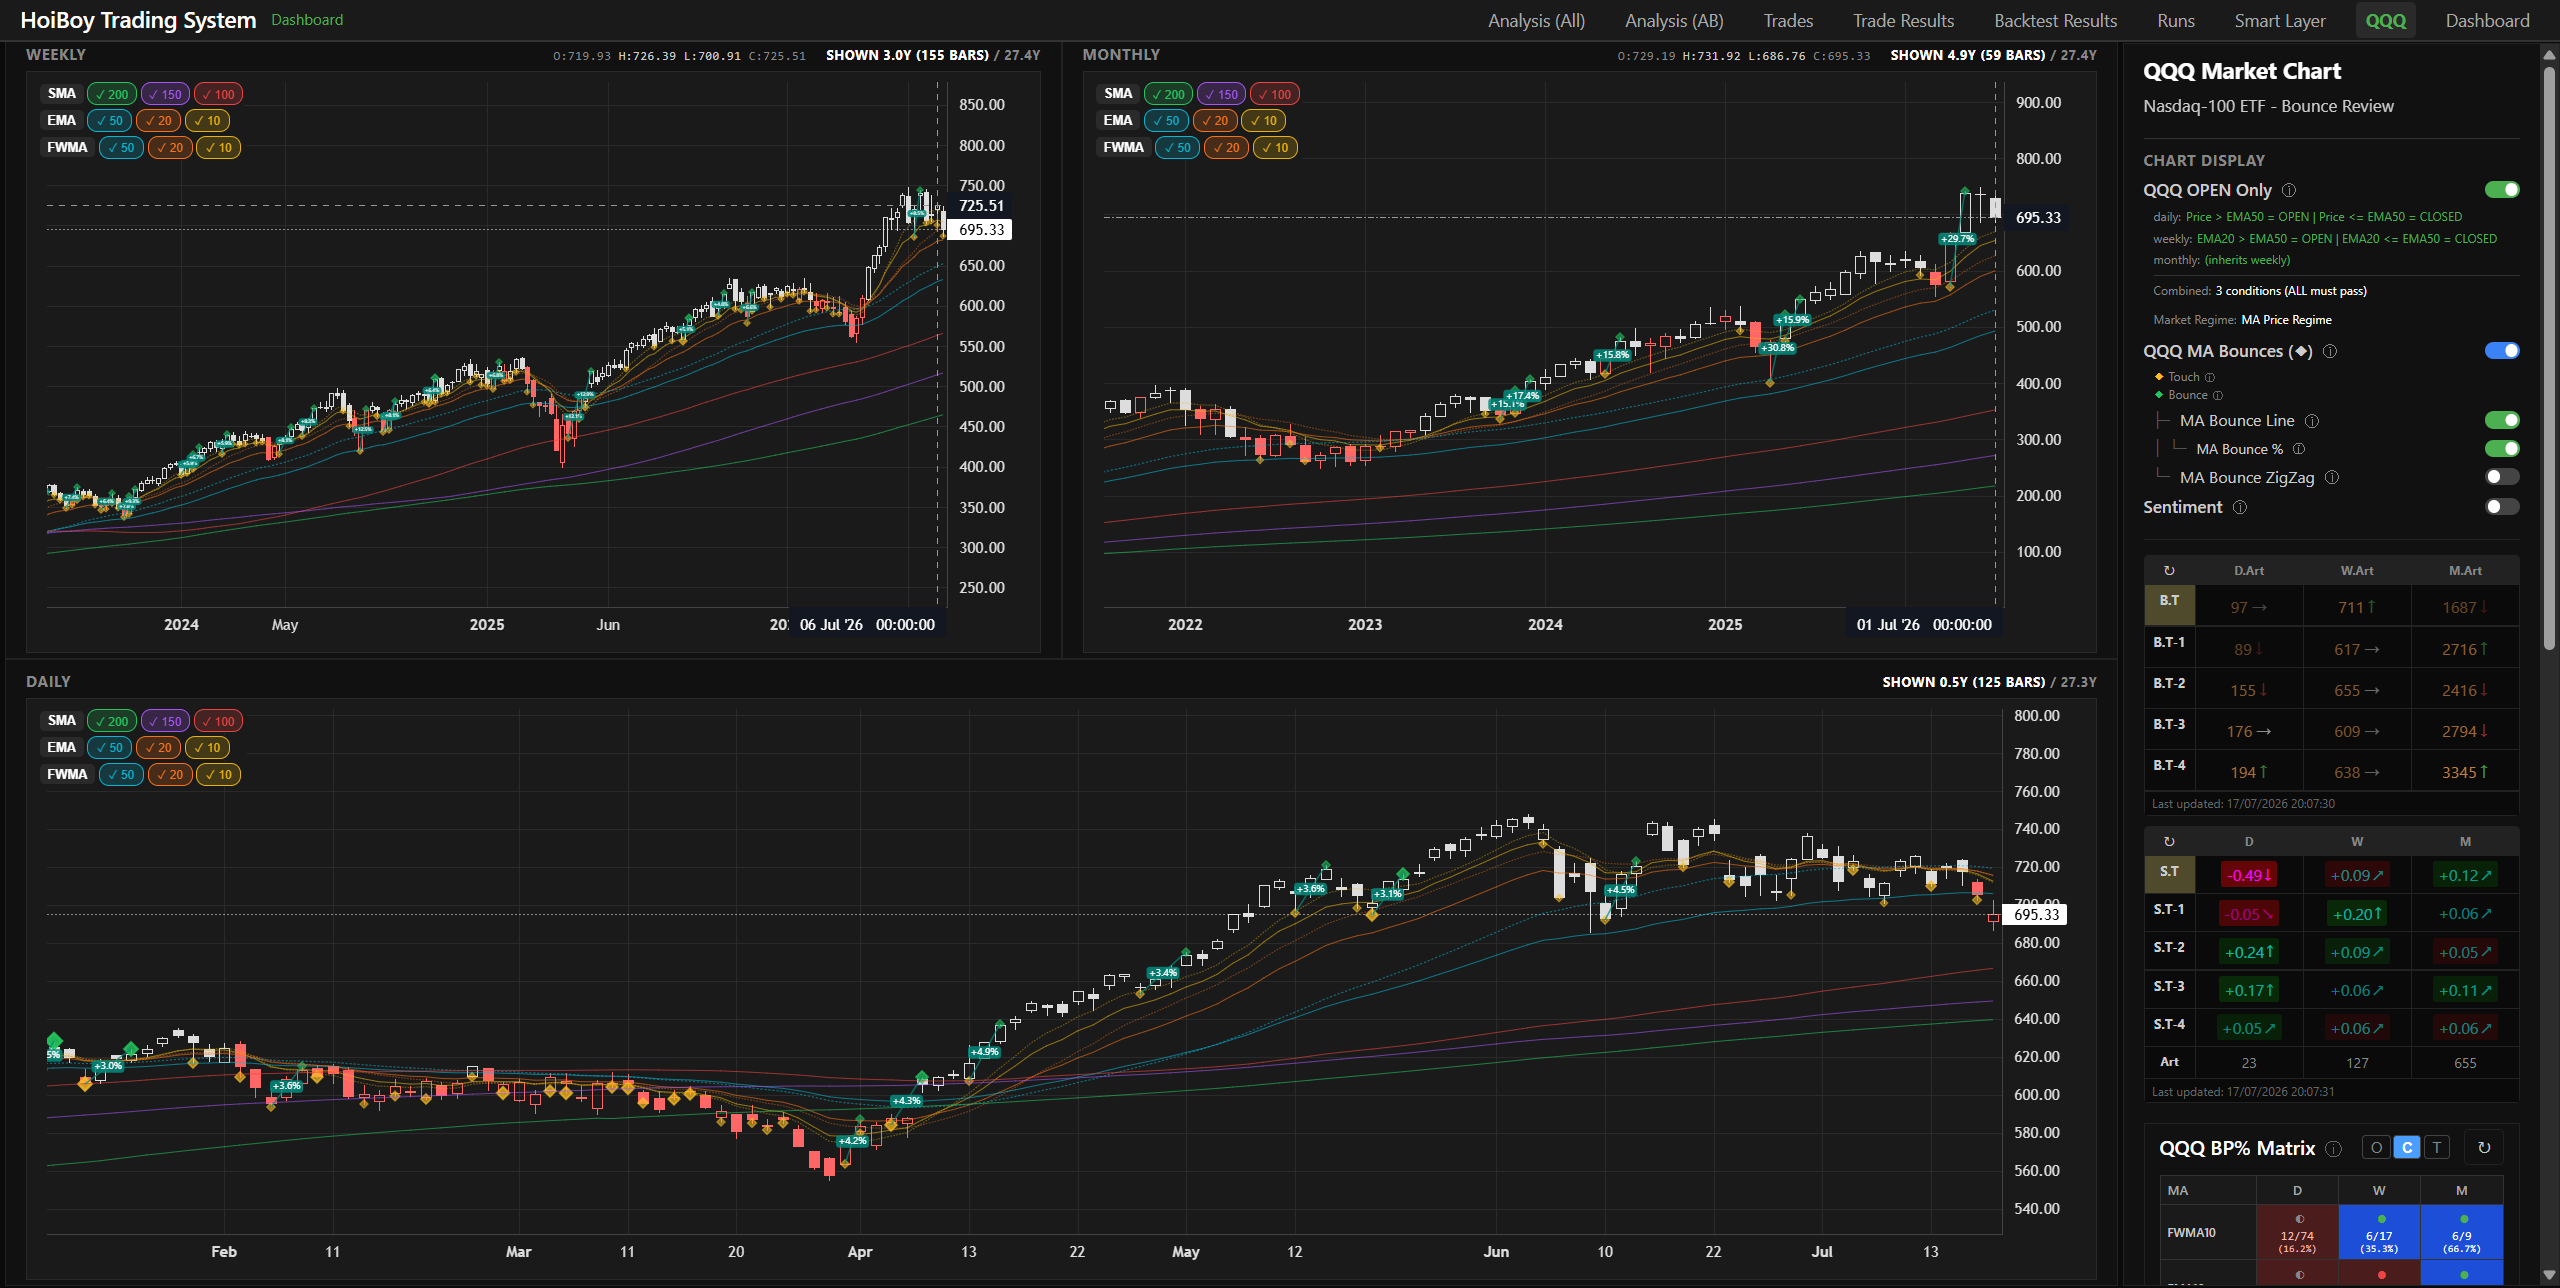
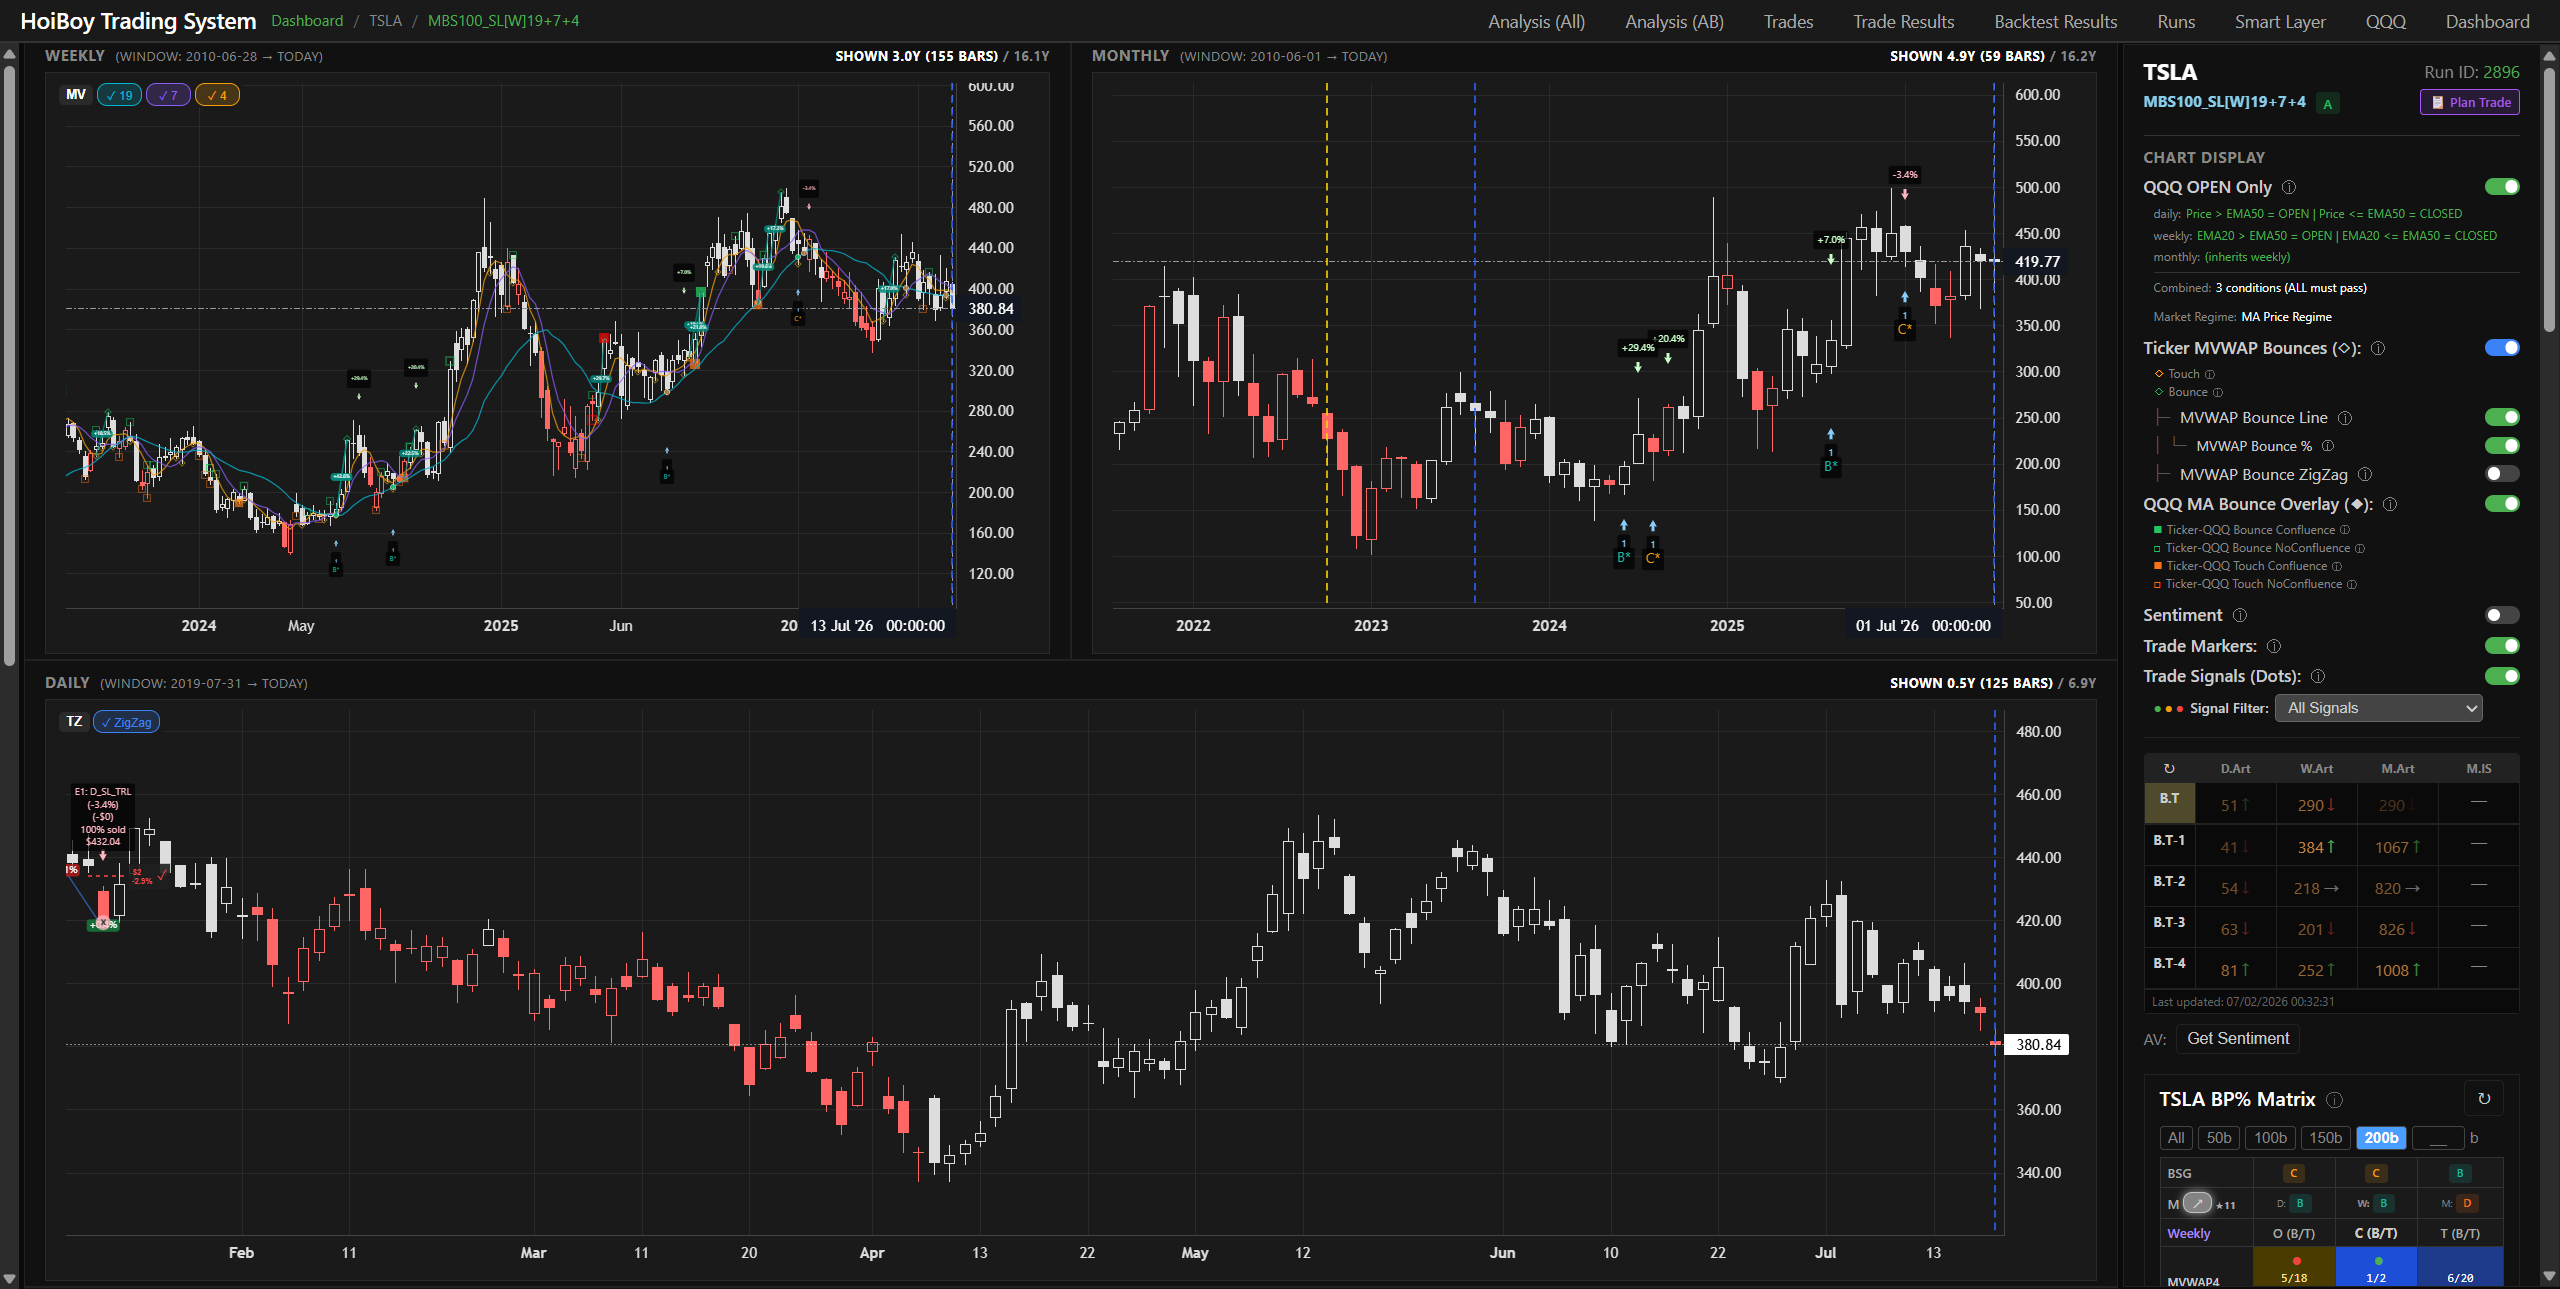
The best part of doing it this way: those white and red regime candles show up on every chart in my system, not just the QQQ. TC2000 can’t do that. It is not timeframe agnostic, so it can’t combine a daily and a weekly formula into one signal. Sucks, but that’s just how it is.
Final words
Just remember, there is no golden signal. Nobody actually knows what the market will do next. What we can do is take everything we understand and make a decent guess at where it might head, for the next bet. That is what all those months of studying are really for. It is never a guarantee.
I fine-tuned some of this through study, yes. But honestly, most of what I learned came from losing money when a bet went wrong, then going back over the market conditions afterwards to work out what I missed. That is what builds the intuition, the feel you get from staring at all this information that no algorithm could easily calculate. And I’m deliberately trying not to overengineer it.
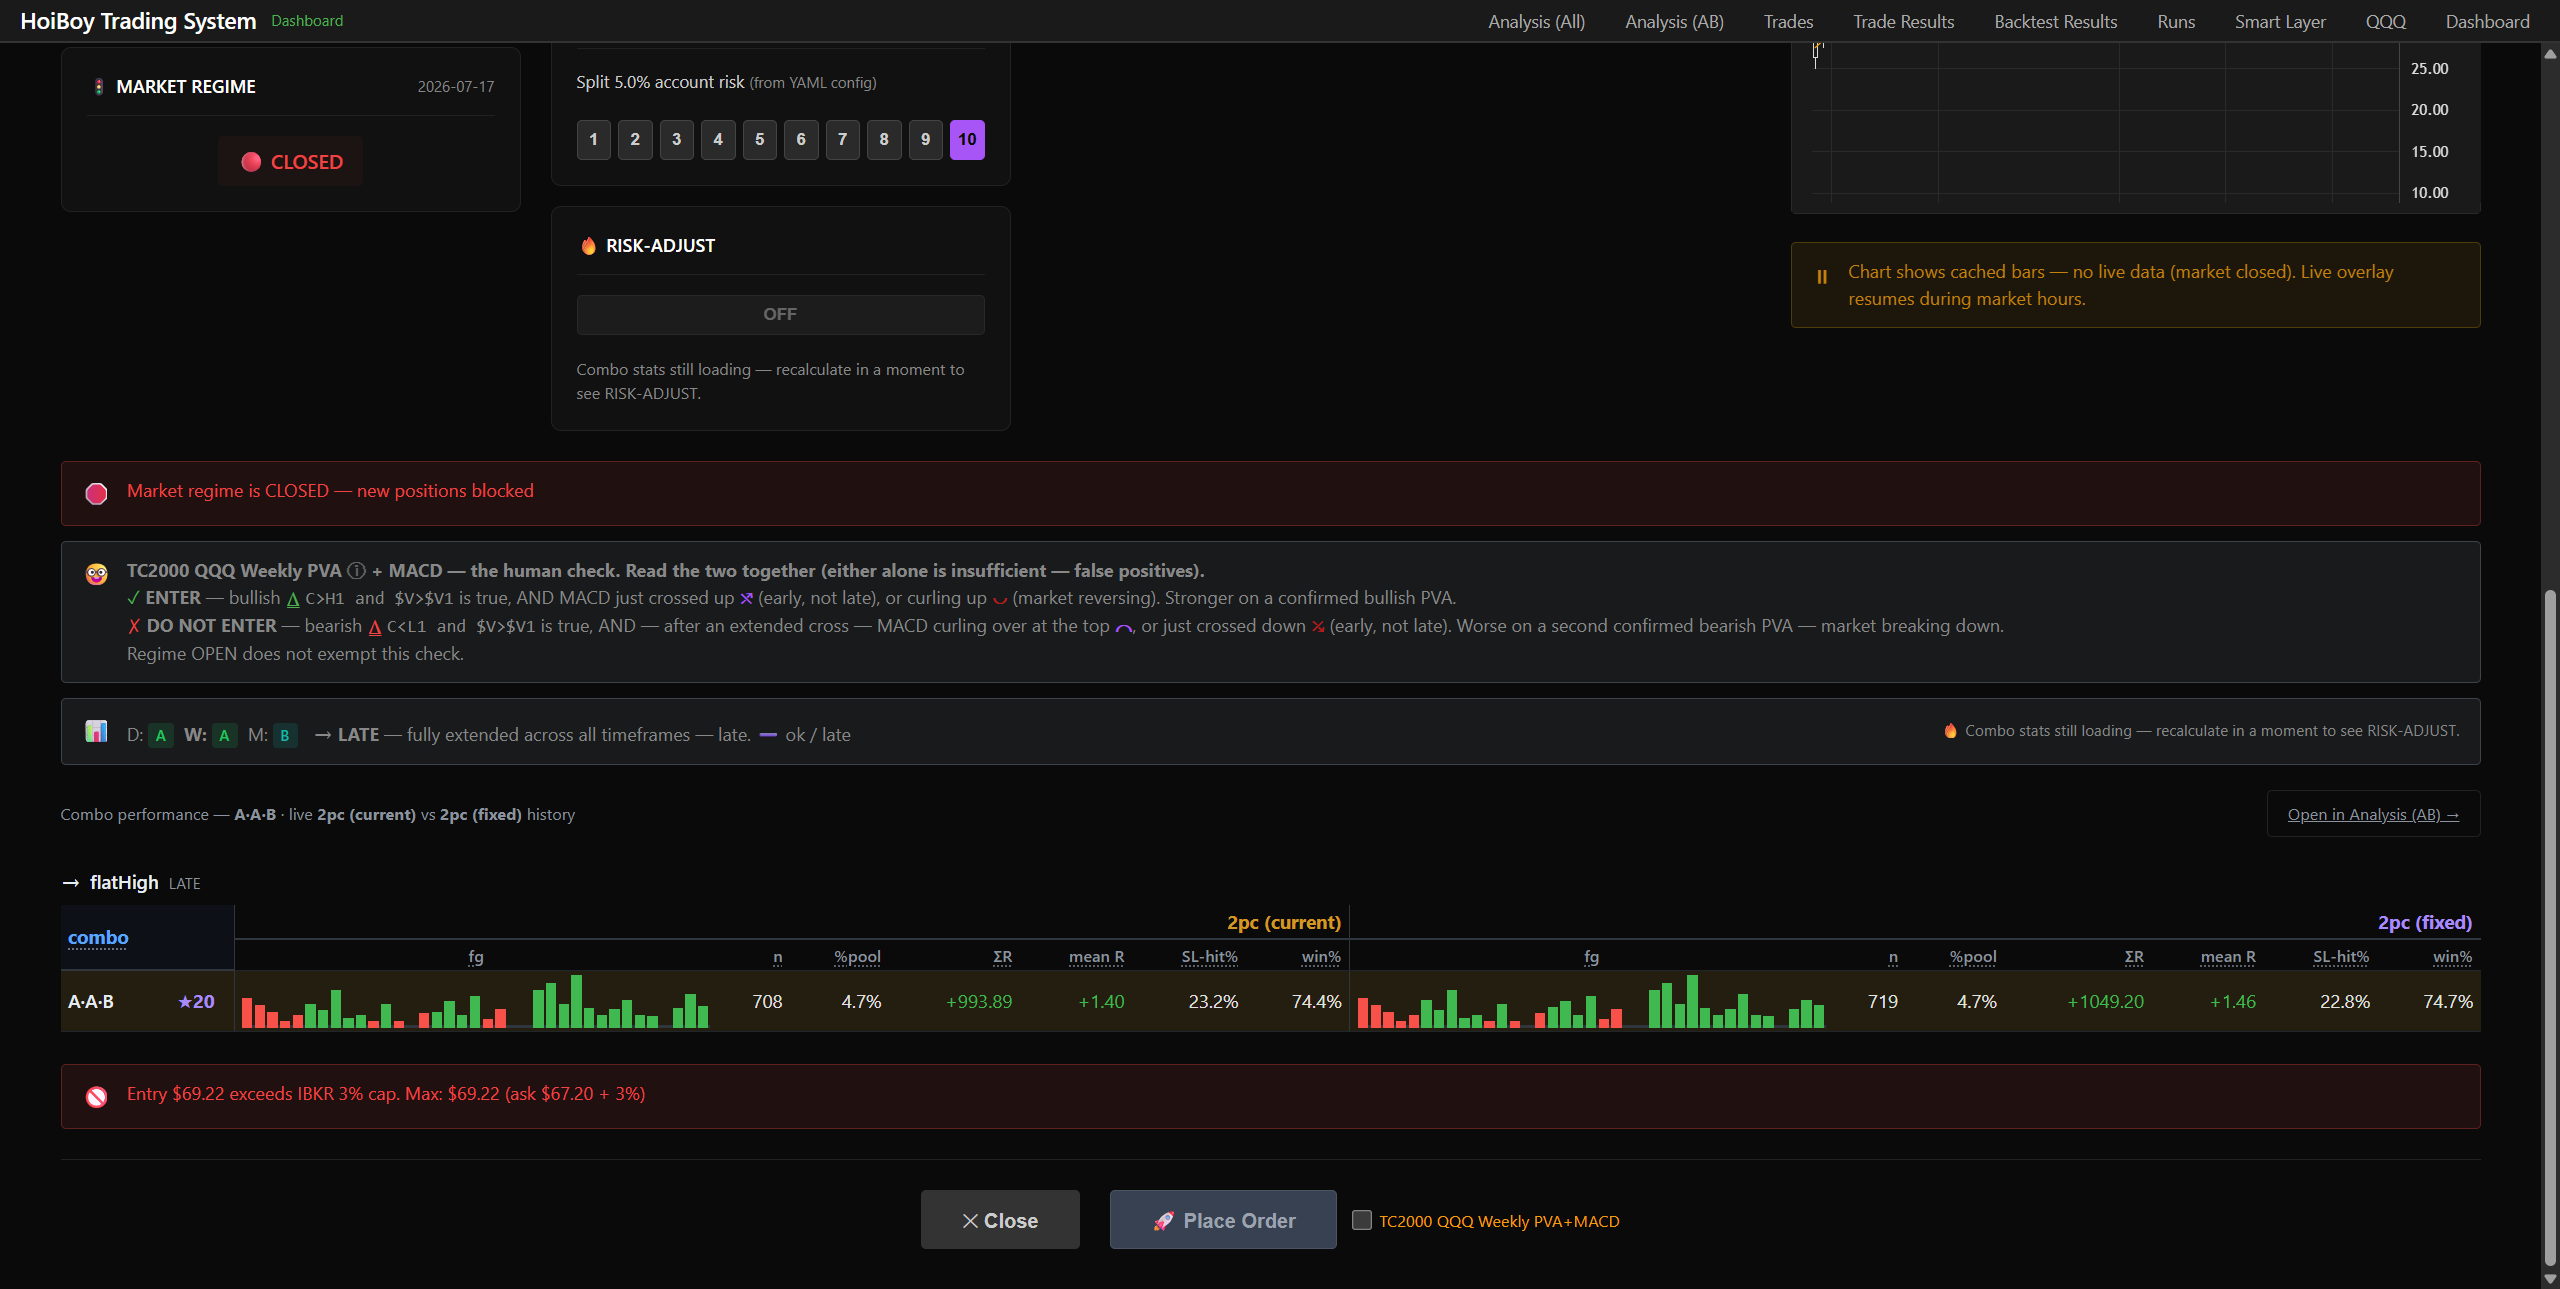
That is exactly why angle number 2, the PVA + MACD read, is built as a human in the loop check (HITL, a step the system will not let me skip). There are too many nuances in it to hand cleanly to an algorithm, so I keep myself in the loop. (If you want the longer story of how I got into any of this, it is in my baby steps to becoming a professional trader.)
And here is that latest human in the loop design, live on my plan-trade page (built with Claude Code under my SST3-AI-Harness workflow, same as the rest of the platform). It reminds me what I am looking for, tells me to go and review my study notes, and makes me tick the box before it will let me place an order. I’ve forgotten this step too many times and paid for it lol. So dumb right? Hence why I built it into the workflow, permanently.