Is 10 Years of Backtest Data Too Much? My Overfitting Tests
Four months ago, my trading system went live. At that point it was running on a flat 10 years of backtest data (a backtest is replaying your strategy over historical data to see how it would have done), right up to today’s date, for all 3 timeframes I trade: daily, weekly, and monthly. Then I decided to put it on pause for a few weeks, because I realised I hadn’t done any overfitting tests, and I had optimised my system according to that one slice of data.
A few weeks or 1-2 months at best. Lol. It turned into 3-4 months.
So What Is Overfitting?
Basically, taking a flat 10 years of backtest and rolling with that isn’t enough for me to understand the system. Too long of a date period may have worked in the past, but that doesn’t mean it will work in the future, with unknown data that is yet to come. The stock market is one of those things that no one really knows. It’s such a complex system, with so many moving parts and variables that can affect it.
That’s my own definition. Here is how other sources describe it: AlgoTrading101 calls overfitting “the process of designing a trading system that adapts so closely to historical data that it becomes ineffective in the future”. Some people call it curve fitting. There are even academic papers written about backtest overfitting, if you fancy a heavier read.
The Plan: Slice It Up
So how do I plan to overcome this, and verify (or at least dampen) the effect of my backtests being “overfitted” and not working in future cases? Especially on the daily timeframe, where 10 years of backtest is a LOT of data that worked in the past, but maybe not in future events.
Well, my trading system was built as a stock personality finder (it profiles how each stock behaves, rather than forcing one strategy onto everything). So I thought, okay… why don’t I backtest slices of data, and then get Claude Code to assist in analysing the results, to see if we can find some kind of pattern, correlation, or relationship in how a stock’s personality changes over time? And obviously, how big events can impact it.
17 Slices, 340,000 Backtests
That became the last 3-4 months of work, finishing just 2 weeks ago. 17 sliced date periods, with the exact counts straight from the database:
- 1x 10 years: 51,730 backtests, 1.03 million simulated trades
- 2x 5 years: 65,771 backtests, 818,000 simulated trades
- 3x 3 years: 62,451 backtests, 613,000 simulated trades
- 1x 15 years (monthly timeframe only): 6,112 backtests, 17,000 simulated trades
- 10x 1 year (daily timeframe only): 124,624 backtests, 962,000 simulated trades
Each slice ran the same 1,022 tickers across the 3 timeframes (daily, weekly, monthly) for 8 different strategies. Those 1,022 tickers are 20% of my stock universe, which is just over 5,000 stocks after filtering my minimum criteria on TC2000 (the market scanning software I use). And on top of all that, the final optimised backtest data was also used to sanity check the overfitting tests of all 17 slices.
I asked Claude to count the total from the database while writing this post: just over 340,000 individual backtests. To be exact, 341,976: the 17 slices add up to 310,688, and the final optimised config used for the sanity check adds the rest. Worth being clear on the units, because they are two different things: a backtest is one ticker, on one timeframe, with one strategy, replayed over the slice’s date period, and each backtest simulates a whole history of trades. Counting everything in the database today, that’s over 3.7 million simulated trades, which deduplicate down to 938,680 unique ones. That dedup set is the research base the rest of the analysis is built on.
Running so many backtests actually helped iron out even more bugs, especially as the Claude Code models kept improving mid-flight. They changed from Opus 4.5, to Opus 4.6, then 4.7, and now Opus 4.8 is already here! And here comes Fable 5!
No Such Thing as FOMO
I kept my paper account running through all of this (a paper account trades the same system with fake money), and it did make some nice trades on the big bounce back in April. Lol, wish that was my live cash account! Anyways, one thing I’ve learned over the last 3 years is that there are always opportunities to make money on the market, so there is no such thing as FOMO (fear of missing out). Just be patient until the next correction… which seems to be happening now.
Analysing the Data
When it came to analysing the data, Claude Code came up with some ideas, but I still had to add a lot of my own ideas on how the data should be analysed. Trying to tackle it from as many angles as possible, we used over 200 agents and went into the hundreds of millions of tokens just to come up with our analysis (all of it run through my SST3-AI-Harness, the same harness that built the system in the first place). We documented everything thoroughly, and then made the key decisions on how we want to optimise the system.
The first thing we did: the backtest date periods changed from a flat 10 years for every timeframe to this:
- Daily = 6 months
- Weekly = 3 years
- Monthly = 5 years

Is it 100% optimised? Nah. It’s good enough, and we have to move on, otherwise we could end up doing this forever instead of trading!
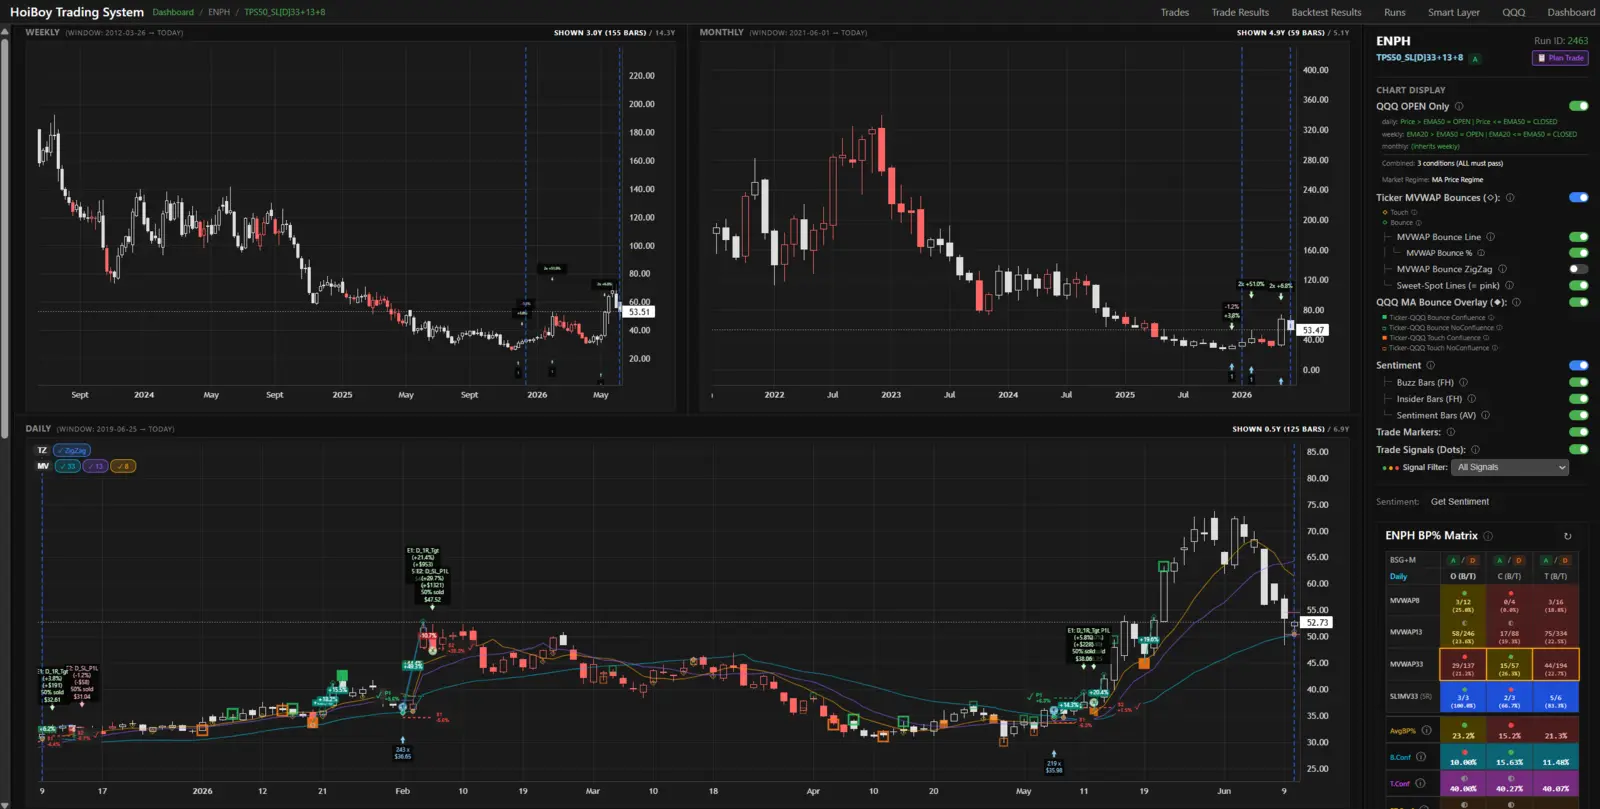
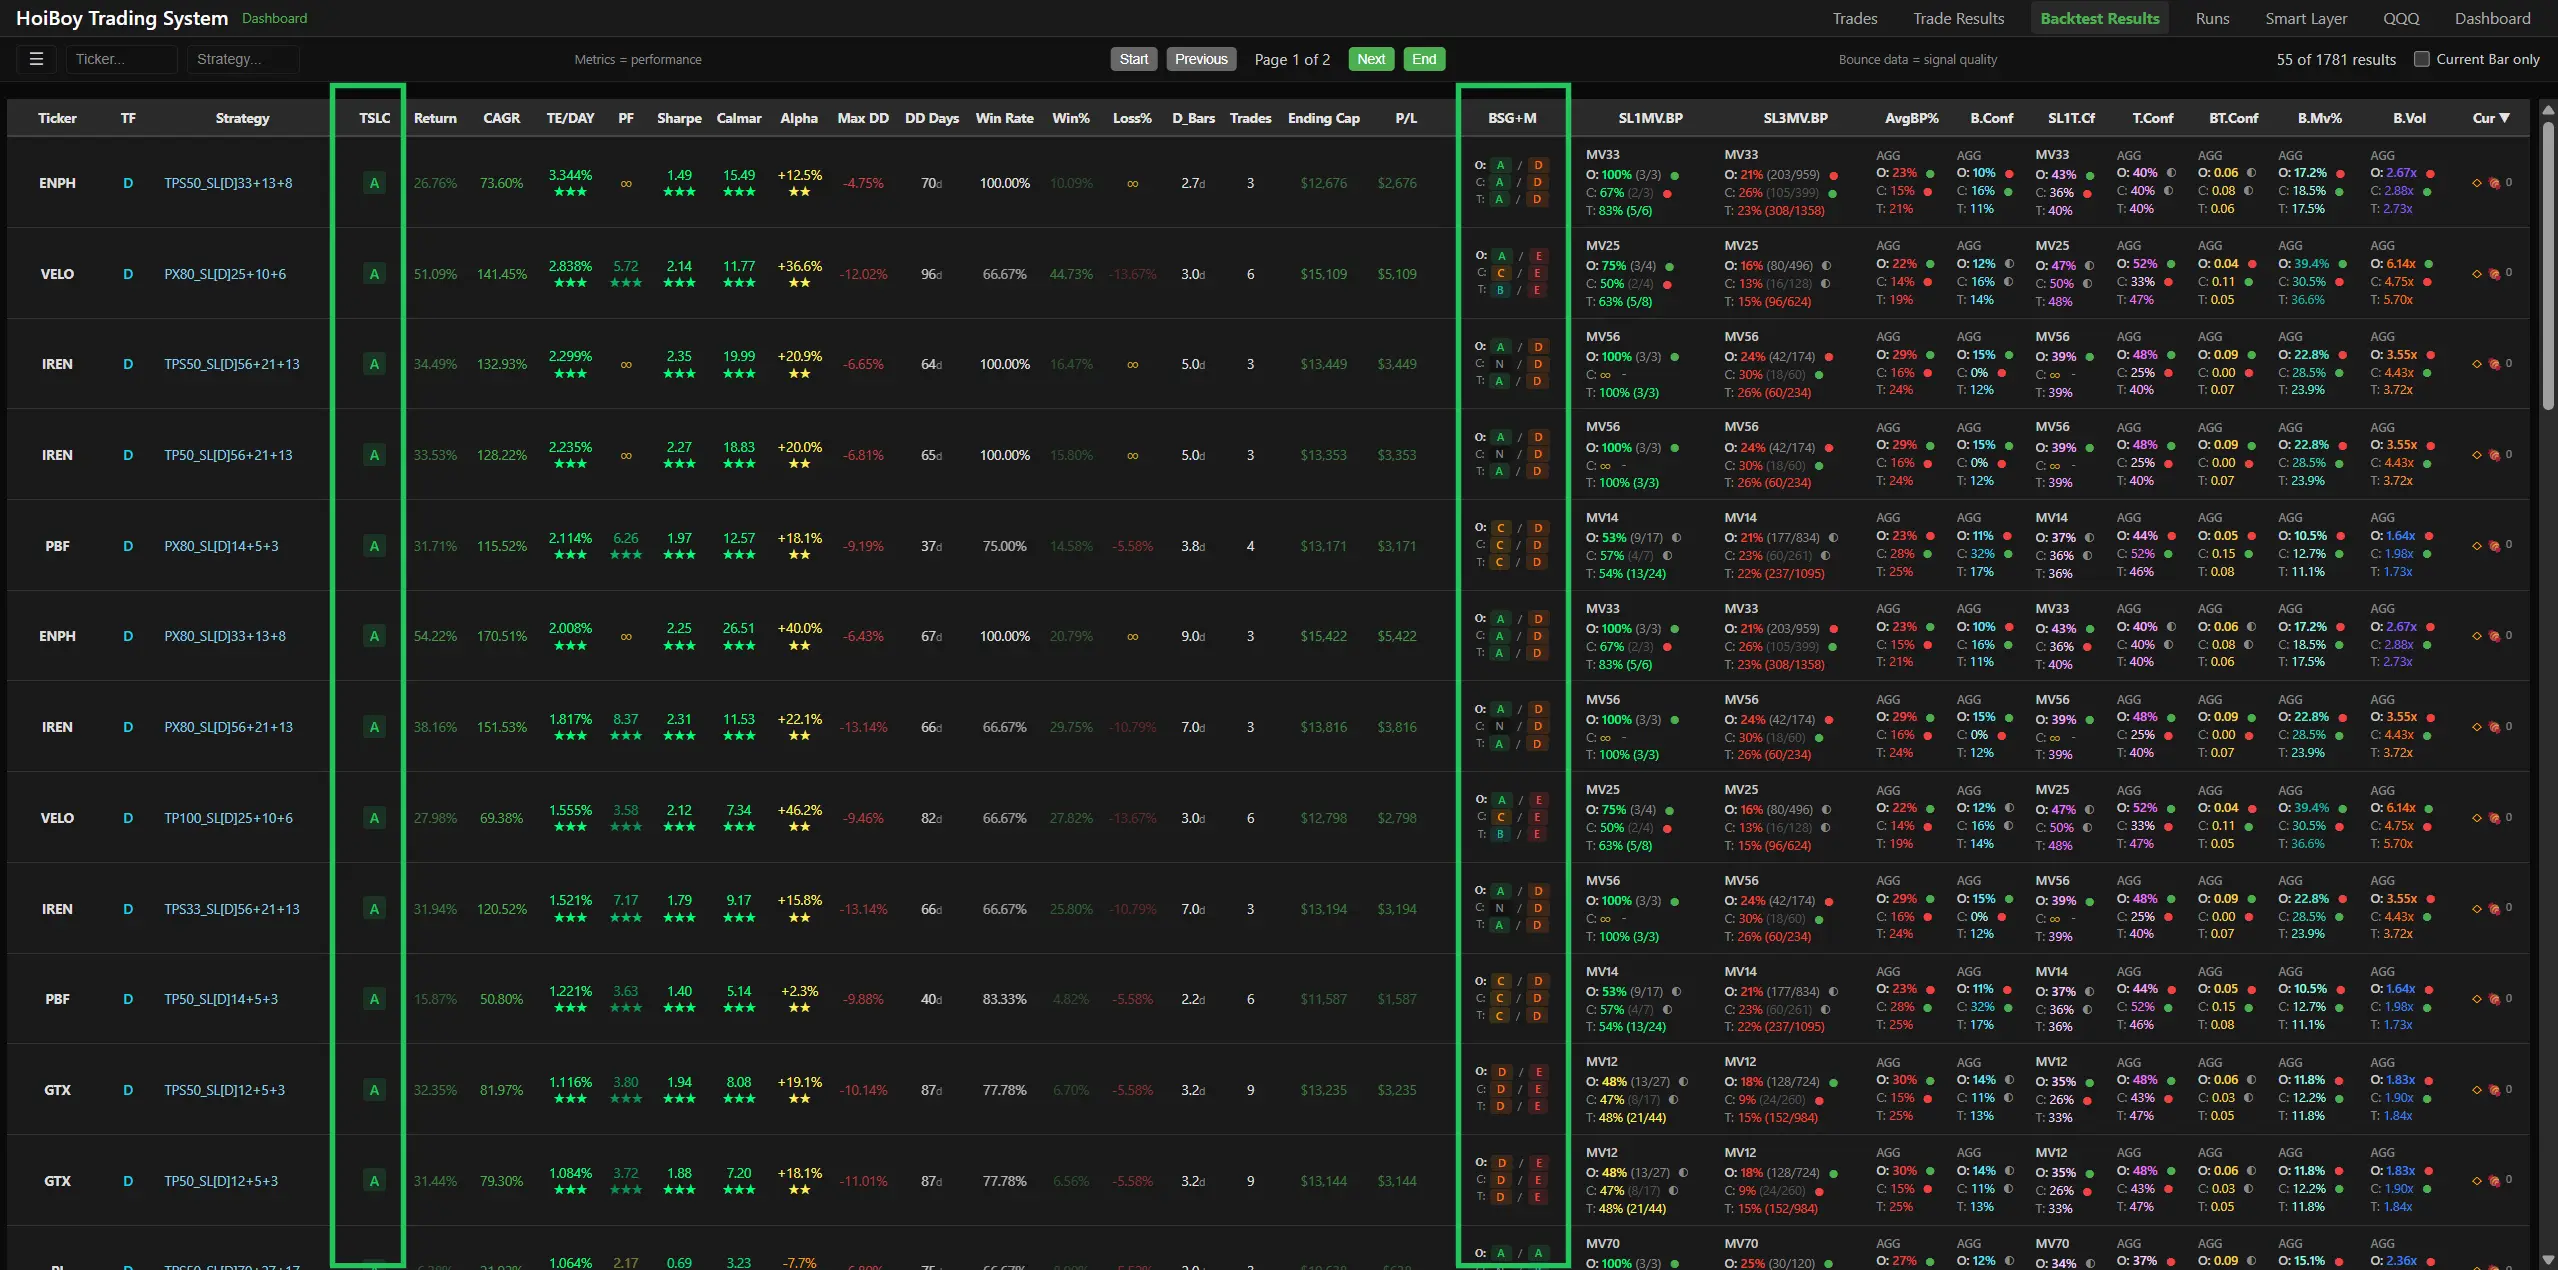
The Regrade
We ran a backtest with this new calibration on our 1,022 tickers plus another 300+. Then we optimised some of our colour intensity settings, and most importantly, we regraded our 2 types of grading: TSLC (Tactical Smart Layer Compounder) and BSG (Bounce Signal Grade). We also added an M (Maturity grading) to the BSG, so it’s now a double grade system: BSG+M.
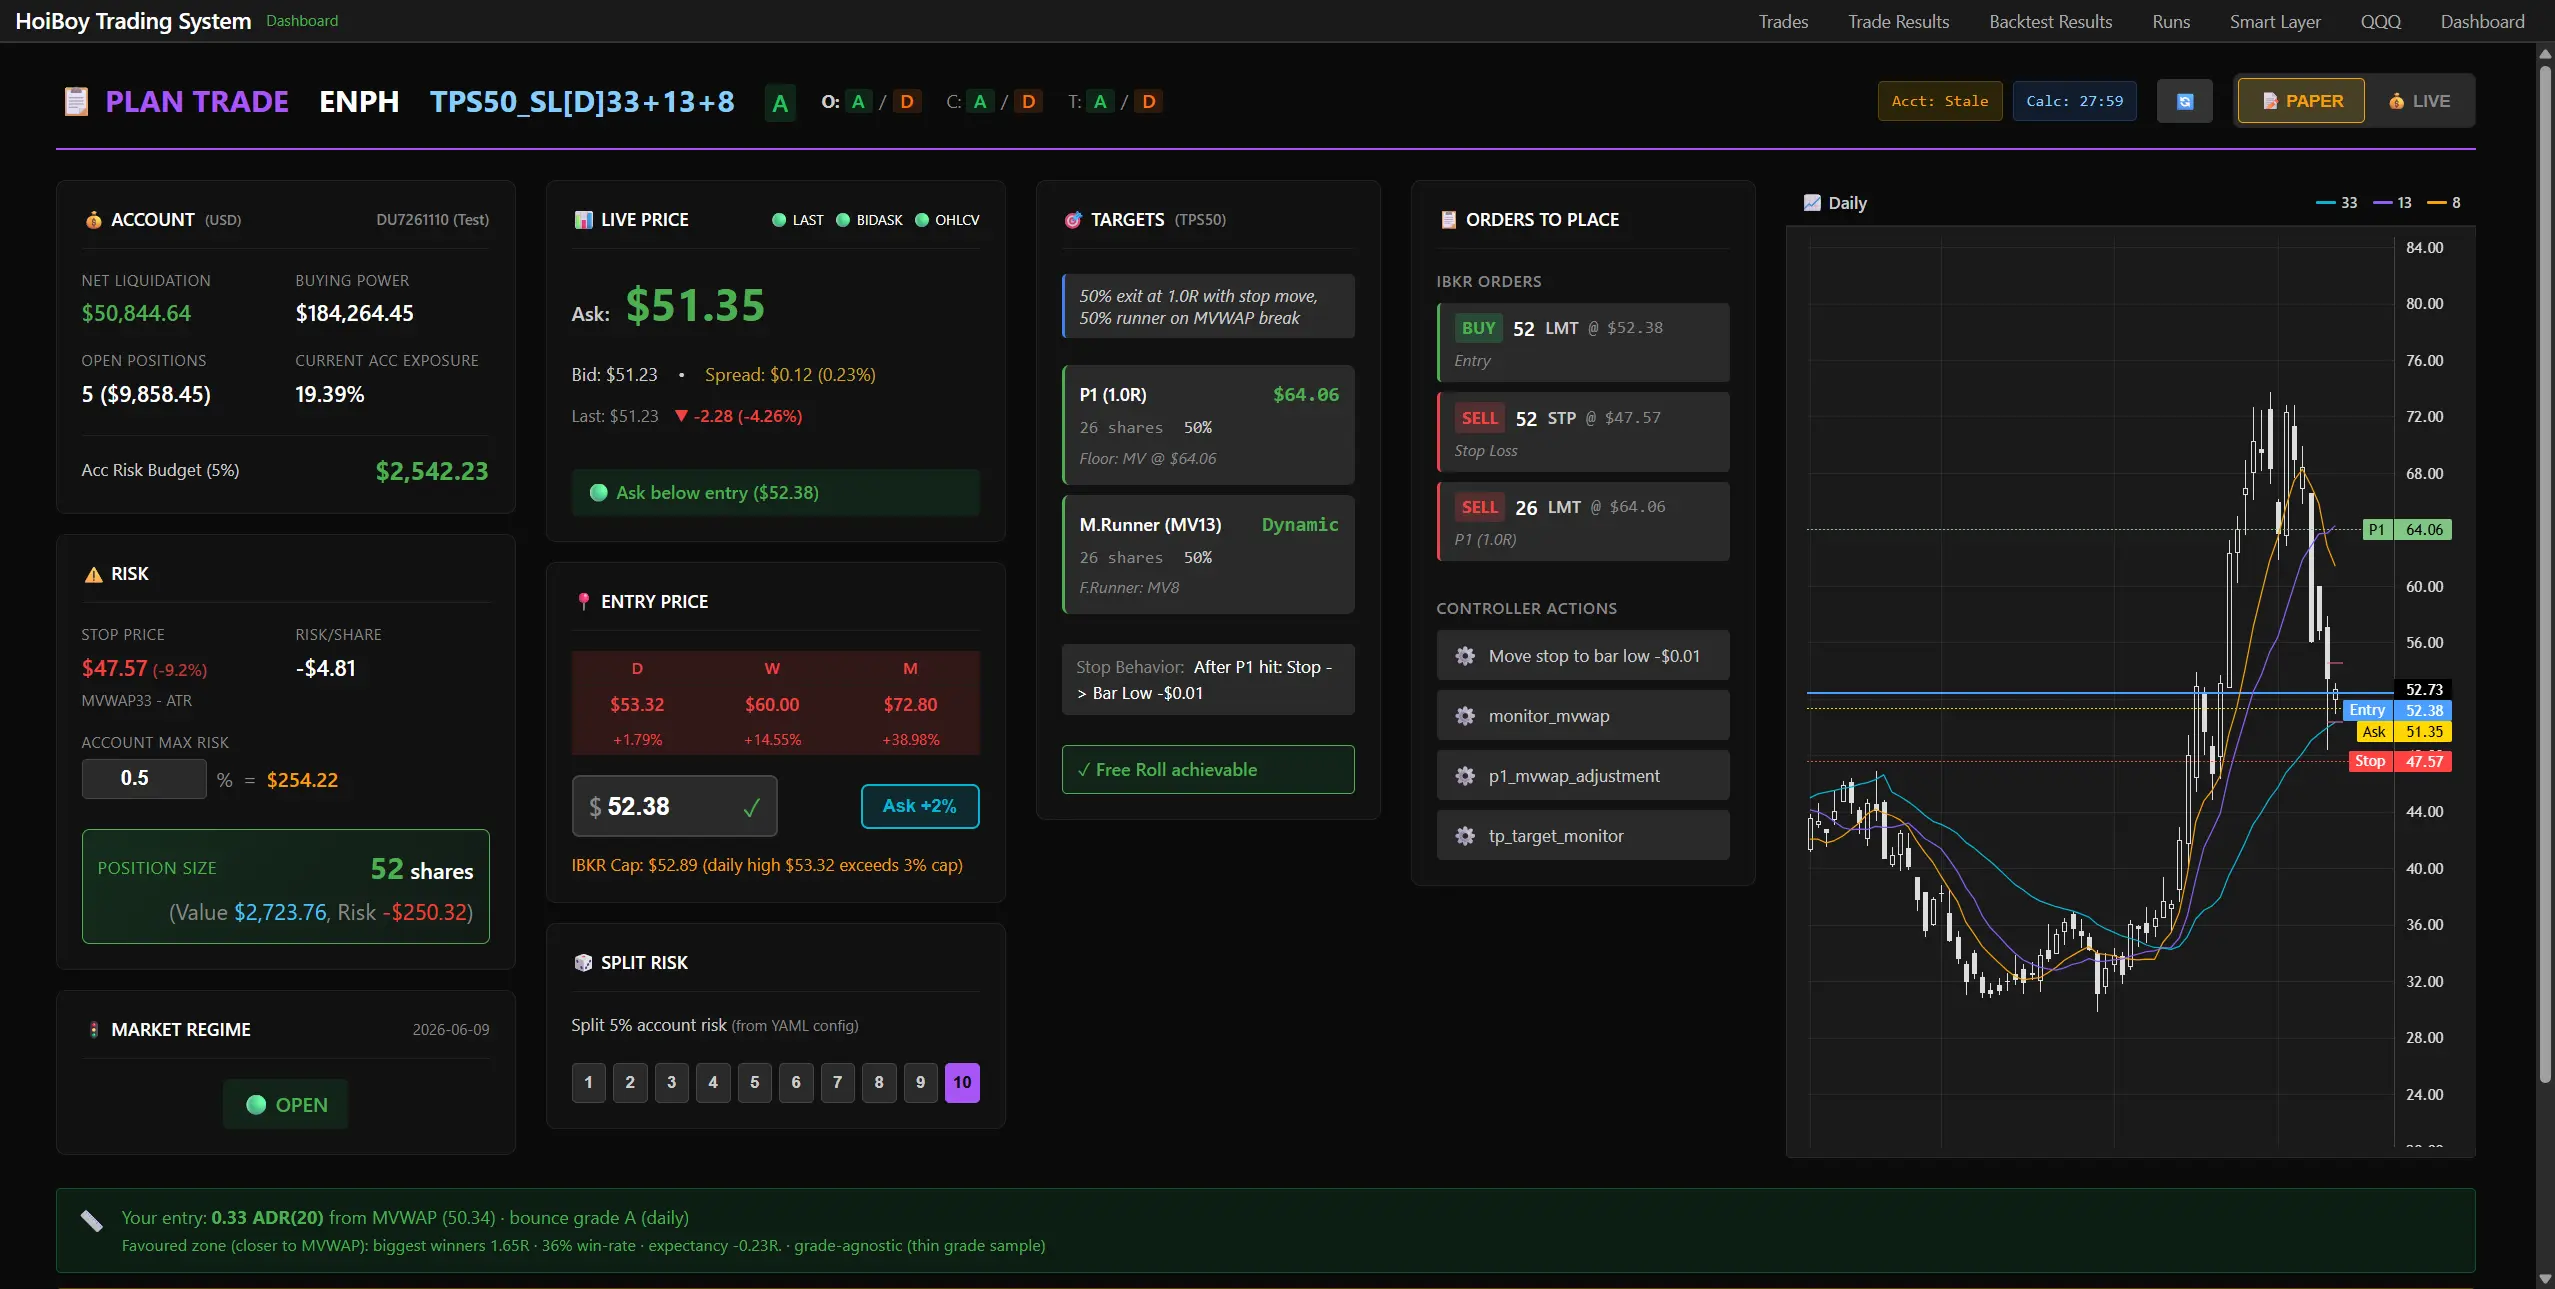
Back in the Game
I am live trading again. I did a few small trades just to make sure my live controller is working okay, since there have been a few more refactors, and found a few weird bugs which I won’t go into details about. FYI, even when the paper controller works fine, it doesn’t mean the live controller behaves the same. There are some quirks because of the account type: an ISA (my live account, the UK’s tax-free investment account) vs a normal trading account (paper).
Time to watch the market, and get ready to be back in the game on this correction.
It’s a Continuous Fine-Tuning Overhead
Last words, I am in the midst of doing a massive fine-tuning. Though I will continue to trade live cash now, it’s more about tightening up the bounce threshold from a 4% range down to a 2% range for more strict bounces. But let’s see how that goes, I may end up fine-tuning it to 3%, in between what it was and the new set of backtests I will run. However, the system is good enough and stable enough and reliable enough for me to not worry about it doing weird shit with real money. Fingers cross!